

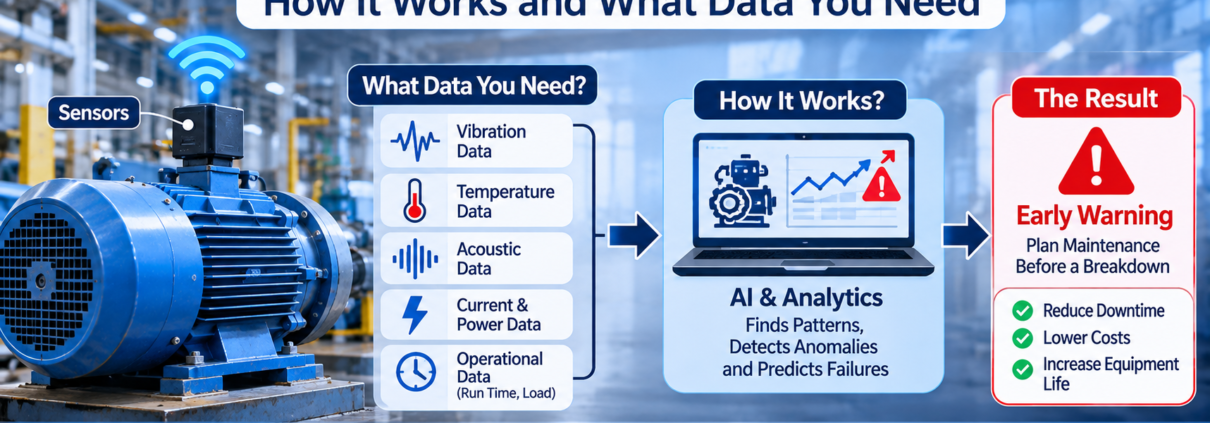
Predictive Maintenance in Manufacturing: How It Works and What Data You Need
Predictive maintenance is a maintenance strategy that uses equipment data and models to estimate when an asset is likely to fail, so repairs are scheduled before breakdown but not earlier than needed. It sits between fixed-interval preventive maintenance and waiting for something to break.
Many plants have tried a version of this and been disappointed. The usual cause is not the algorithm. It is the data feeding it: sensors that were never installed on the assets that matter, maintenance records that say “repaired pump” with no failure mode, and alerts that arrive with no link to a work order. This guide explains how predictive maintenance works, how it differs from other strategies, what data it needs, and how to judge whether a pilot is paying off.
Five maintenance strategies compared
| Strategy | Trigger | Strength | Weakness |
|---|---|---|---|
| Reactive | Failure | No planning effort | Unplanned downtime, secondary damage |
| Preventive | Calendar or run hours | Simple to schedule | Replaces healthy parts, still misses random failures |
| Condition-based | A measured threshold is crossed | Acts on actual state | Thresholds are often set by guesswork |
| Predictive | A model forecasts failure | Lead time to plan parts and labor | Needs history and quality data |
| Prescriptive | A model recommends the action and timing | Links the forecast to a decision | Needs tight integration with planning and CMMS |
Most plants use a mix. Run-to-failure is perfectly sensible for a cheap, redundant, non-critical asset. Predictive approaches pay off on assets where failure is costly, hard to schedule around, or dangerous.
How predictive maintenance works
A typical system follows five steps.
- Collect. Sensors and control systems record vibration, temperature, current, pressure, flow, speed and other signals, alongside operating context such as product and load.
- Clean and align. Timestamps are synchronized, bad readings are removed, and sensor data is joined to asset records and maintenance history.
- Detect. Models learn what normal looks like for each asset and flag departures from it. This is anomaly detection.
- Predict. Where enough failure history exists, models estimate remaining useful life or the probability of failure in a time window.
- Act. The alert becomes a work order with the asset, the suspected failure mode and a recommended window, sent to the maintenance system.
The last step decides whether the project works. An alert that sits in a dashboard changes nothing. An alert that creates a work order, reserves a part and fits a planned stop changes the outcome.
The P-F curve idea
Failures usually do not happen instantly. A bearing, for example, shows early signs such as small vibration changes long before it seizes. The period between the first detectable sign (potential failure) and functional failure is the lead time you can use.
Different techniques detect different points on that curve. Vibration analysis often catches mechanical wear early. Temperature changes tend to appear later. Oil analysis detects certain faults well ahead of other signals. The practical consequence is that predictive maintenance is not one sensor and one model. It is matching the detection method to the failure mode and to the lead time you need to plan a repair.
What data you need
| Data type | Examples | Why it matters |
|---|---|---|
| Condition data | Vibration, temperature, current, pressure | Signs of degradation |
| Operating data | Speed, load, product, cycle count | Separates normal variation from real change |
| Maintenance records | Work orders, failure codes, parts used | Labels for what failed and when |
| Asset master data | Model, age, location, criticality | Groups similar assets and ranks priorities |
| Event data | Alarms, trips, stops | Context around failures |
Maintenance records are the commonly weakest link. Free-text work orders and missing failure codes make it hard to teach a model what a failure looked like. Improving failure-code discipline often delivers value before any model is built.
Do you need years of failure history?
Not always. Anomaly detection can start with normal operating data and flag unusual behavior without many labeled failures. Remaining-useful-life prediction needs more history, particularly examples of run-to-failure. For rare, high-cost failures where history is thin, combine anomaly detection with engineering knowledge of failure modes, and treat early alerts as prompts for inspection rather than certainties.
Reliability metrics you should know
- MTBF (mean time between failures) = total operating time ÷ number of failures
- MTTR (mean time to repair) = total repair time ÷ number of repairs
- Inherent availability = MTBF ÷ (MTBF + MTTR)
Worked example (illustrative): a press runs 4,000 hours in a period and fails 5 times, with a total repair time of 40 hours.
MTBF = 4,000 ÷ 5 = 800 hours MTTR = 40 ÷ 5 = 8 hours Availability = 800 ÷ (800 + 8) = 99.0 percent
If predictive work cuts the failure count to 4 and shortens repairs through better preparation to 6 hours each, MTBF becomes 1,000 hours and MTTR 6 hours, so availability is 1,000 ÷ 1,006, or 99.4 percent. The gain looks small in percentage terms, but if the press is a bottleneck, those hours are worth real output.
How to judge model quality
Accuracy is a poor measure when failures are rare. A model that never predicts a failure can still be “99 percent accurate.” Better measures are:
- Precision: of the alerts raised, how many were real problems?
- Recall: of the real problems, how many were caught?
- Lead time: how far ahead of failure was the alert?
- False alert rate: how many alerts per asset per month reach the maintenance team?
A system that raises too many false alerts loses its audience quickly. Tune for the trade-off the maintenance team will accept, and measure it from the start.
Building the business case
- List critical assets by downtime cost per hour, safety impact and repair cost.
- Estimate avoidable events from your own history, such as breakdowns that gave warning signs.
- Estimate the value of each avoided event: lost output, scrap, overtime, expedited parts and secondary damage.
- Subtract costs: sensors, integration, platform, support and the time of maintenance staff.
- Pilot on a handful of assets and compare against a baseline period or similar untreated assets.
Treat vendor payback figures as ranges to test, not promises. Results depend on your starting maintenance maturity, data quality and how disciplined the response to alerts is.
A pilot plan that works
- Weeks 1 to 2: choose 5 to 10 critical assets, check available data, and define success measures.
- Weeks 3 to 6: connect data sources, establish baselines, and validate signals with reliability engineers.
- Weeks 7 to 12: run alerts in shadow mode, comparing predictions with what technicians find, then switch on work order creation for validated alert types.
- After the pilot: review precision, lead time and avoided downtime, then decide where to expand.
Common mistakes
- Starting with the model before fixing sensor coverage and failure codes.
- Choosing assets because they are easy to instrument, not because failure is costly.
- Leaving out maintenance planners, who decide whether the alert becomes a repair.
- Ignoring operating context, so a normal change in load triggers false alarms.
- Measuring success by alerts raised rather than failures avoided.
Where Infocepts fits
Infocepts’ Predictive Maintenance Intelligence Agent is designed to connect to existing systems such as SAP, MES, SCADA, IoT sensors and CMMS or EAM platforms, monitor asset health, flag anomalies and support work order creation. It is one of the specialist agents in the Infocepts manufacturing platform and uses the same governed KPI definitions as the rest. Related reading: OEE calculation and the Six Big Losses and digital twins in manufacturing.
FAQ
What is predictive maintenance in manufacturing?
It is the use of equipment data and models to forecast failures so maintenance can be scheduled in time.
How is predictive maintenance different from preventive maintenance?
Preventive maintenance follows a calendar or usage interval. Predictive maintenance acts on the condition of the asset.
What sensors are used for predictive maintenance?
Common ones measure vibration, temperature, electrical current, pressure and flow. The right choice depends on the failure modes you want to detect.
How much data do I need to start?
Anomaly detection can start with normal operating data. Predicting remaining useful life needs history that includes failures.
How long does it take to see results?
It depends on asset criticality and the data available. A scoped pilot of a few assets is the best way to find out for your plant.
Does predictive maintenance replace preventive maintenance?
Usually not. Most plants keep preventive tasks for some assets and use predictive methods where they add the most value.
