Services › Business Analytics

Analytics built for adoption

Business analytics services that people actually use

4.9/5

from 55 verified client reviews on Gartner Peer Insights — as of July 2026

Analytics investments often stall on adoption, not technology. We baseline your reporting estate, design for the people who have to use it, and run it – with a 150-person design practice and more than twenty years of enterprise reporting behind it.

4.9/5

Gartner Peer Insights, 55 reviews

150+

UI/UX and design experts focused on adoption

97.2%

Client retention

2004

Delivering enterprise reporting since

Definition

What is business analytics?

Business analytics is the practice of turning enterprise data into reports, dashboards and self-service tools that business users can act on directly. It spans enterprise reporting and BI, the semantic layer that gives numbers a shared definition, conversational and self-service access, and the design work that decides whether any of it gets used.

A complete analytics capability answers four questions: what decisions are we supporting, can people reach the numbers without help, do they trust the definitions behind them, and what is the estate costing us to run.

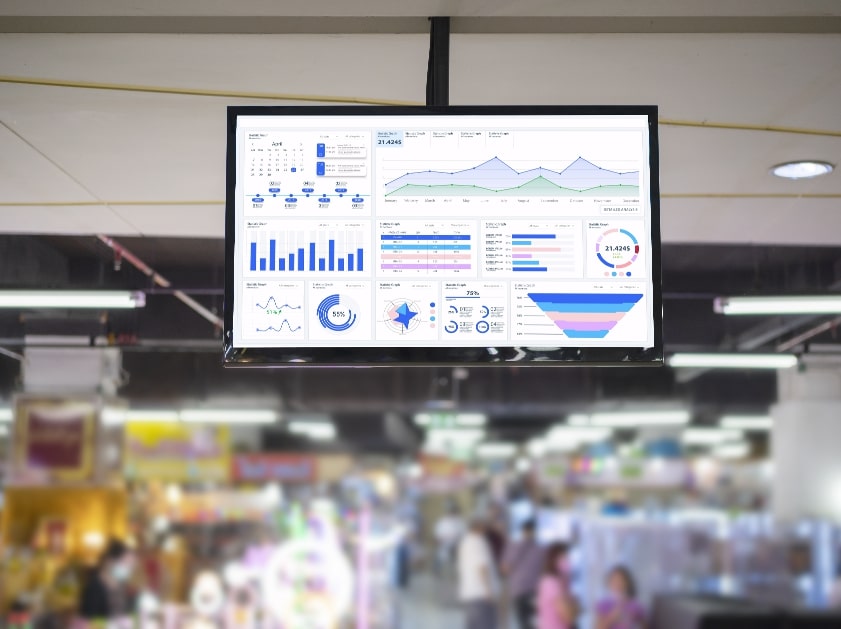
A business analyst reviewing charts and dashboards on a laptop

Analytics rarely fails on technology. It fails at the last mile — a report that is accurate, governed, on time, and opened by nobody. Adoption is a design problem long before it is a data problem.

Infocepts point of view

How is it different from business intelligence?

Business intelligence is the reporting and dashboard layer that shows what happened. Business analytics includes BI, and adds the design of how people interact with the data, natural-language access, the migration and consolidation of the tools involved, and the operating model that keeps the estate useful over time. BI is a layer; analytics is the whole capability.

What makes it different from just owning a BI tool?

A BI tool is software. An analytics capability is that software plus governed reporting, adoption-focused design, and a modernization path off whatever came before. The gap between the two is why organizations can own three licensed platforms and still export to spreadsheets.

The problem

Why analytics initiatives stall before adoption

Not from a shortage of reports. From a surplus of them, built without anyone asking who would open them on a Tuesday morning.

01

Reporting sprawl

Large report estates where only a fraction is opened. Nobody can retire anything because nobody knows which ones matter to whom.

02

Competing definitions

Three dashboards, three margin numbers. Meetings spent reconciling figures instead of acting on them, and trust eroding each time.

03

Legacy tool fatigue

Overlapping licenses and a platform nearing end of life. Migration keeps getting deferred because the true report inventory is unknown.

04

Self-service that isn’t

Tools marketed as self-service that still need a specialist to answer a simple question. The backlog moves, it doesn’t shrink.

Where the cause sits upstream — in ungoverned or fragmented data rather than in the reporting layer — that is a data and AI strategy and data modernization question, and the baseline will say so.

Services

Business analytics services

Four named, separately scoped engagements — so you can compare us directly against any other bidder. Many clients start with the baseline, which makes the right one obvious.

01

Enterprise reporting

Governed reporting and BI built on two decades of delivery, with the manual, error-prone reporting work automated out. Aligned to the decisions your stakeholders are actually making.

02

UI/UX and data product design

Analytics designed as a product with an owner and an audience, by 150+ design experts working on data-driven applications. Interfaces that make complex data straightforward — an accurate report nobody can read is not a delivered report.

03

Conversational analytics

Voice, text and touch access to your data using NLP and machine learning, so self-service is genuinely self-service — and surfaces the questions people were not asking.

04

Analytics migration

Consolidating redundant tools or modernizing legacy ones, with rationalization first so you migrate what matters. Repeatable approach, accelerators, predictable cost.

Need capacity, not a project?

Embedded capacity is one of three delivery models. Our specialists work inside your team, to your process and tooling — to absorb a backlog, cover a skills gap like semantic modeling or UX, or hold delivery steady through a hiring cycle.

Not sure which applies?

Many engagements begin with the baseline, because a usage-ranked report inventory helps settle the migrate-or-redesign question early. Thirty minutes with a practice lead will tell you whether that is true for you.

We work in the tools you already run — Power BI, Tableau, Strategy, Looker, Databricks and Snowflake. We recommend switching only when the baseline shows a clear cost or capability reason, most often overlapping licenses or a platform reaching end of life.

The baseline

The Analytics Estate Baseline

Every engagement starts by measuring what you already run. Four measures anchor it, and ten scored areas explain them.

M1Active usersWho opens analytics, how often, and which functions never do

M2Report usageWhat is used, what is duplicated, and what is safe to retire

M3Time to insightHow long a new question takes to answer, end to end

M4Cost of the estateLicenses, platforms, and the support effort behind them

Ten areas, scored 1–5Maturity scale1 Ad hoc2 Repeatable3 Defined4 Managed5 Optimized

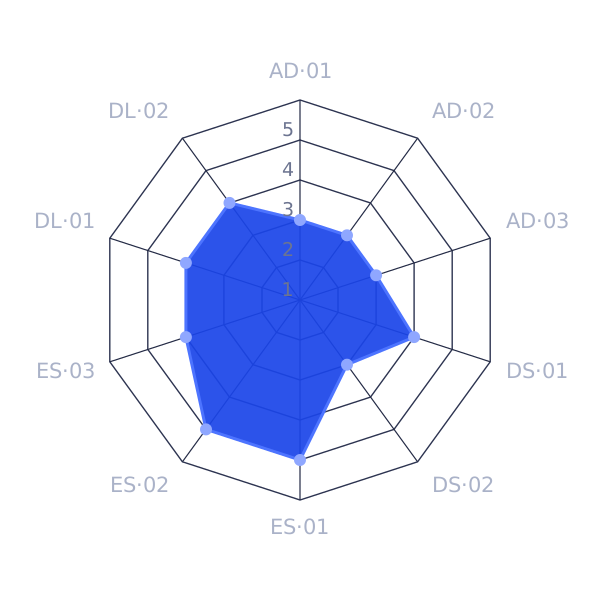
AD·01Adoption

Active usage and reach

How many people across which functions actually open analytics, and how that trends.

2.0

AD·02Adoption

Self-service capability

Whether a business user can answer a new question without raising a ticket.

2.0

AD·03Adoption

Decision adoption

Whether the people the reporting was built for changed how they decide.

2.0

DS·01Design

Data product and UX design

Whether analytics is designed for a task and an audience, or assembled from available fields.

3.0

DS·02Design

Semantic layer and definitions

Whether core metrics carry one agreed definition across every tool that reports them.

2.0

ES·01Estate

Tool landscape and license cost

How many platforms are in use, where they overlap, and what the overlap costs.

4.0

ES·02Estate

Report inventory and redundancy

What exists, what is duplicated, and what can be retired without anyone noticing.

4.0

ES·03Estate

Data foundation and quality

Whether the data underneath is reliable enough to support self-service safely.

3.0

DL·01Delivery

Time to insight

How long a new question takes from asked to answered, and where the queue forms.

3.0

DL·02Delivery

Operating and support model

How analytics is staffed, supported and funded once it is live.

3.0

What the output looks like

Your Analytics Adoption Score on one view

All ten areas on one view, so the argument makes itself. The profile below is an illustrative sample, not client data.

Sample analytics adoption scoreIllustrative

Radar plot of ten analytics adoption areas, scored between 2.0 and 4.0 out of 5

Illustrative sample profile · scored 1–5 · not client data

2.8Overall adoption score out of 5 · illustrative

  • AD·01Active usage and reachRepeatable2
  • AD·02Self-service capabilityRepeatable2
  • AD·03Decision adoptionRepeatable2
  • DS·01Data product and UX designDefined3
  • DS·02Semantic layer and definitionsRepeatable2
  • ES·01Tool landscape and license costManaged4
  • ES·02Report inventory and redundancyManaged4
  • ES·03Data foundation and qualityDefined3
  • DL·01Time to insightDefined3
  • DL·02Operating and support modelDefined3

This is a common shape. A well-run estate scored at 4 feeding adoption scored at 2 means the problem was never the platform — it is that nobody designed for the person expected to use it. Buying another tool moves the estate score, not the adoption score.

What you get

A scored view of all ten areas, a usage-ranked report inventory, an estate cost view, and a sequenced plan for redesign, migration or consolidation.

How it runs

Alongside your BI team rather than pausing delivery, and scoped to the size of your estate.

What it costs

Scoped and agreed up front, so you know what the baseline covers, and what it costs, before you commit.

The method

How we work: baseline, design, build, migrate, adopt

Five stages, run by one accountable team. The last one is the stage many analytics engagements treat as somebody else’s job.

Stage 01

Baseline

Measure usage, inventory, time to insight and estate cost. Score the ten areas and establish what is actually being used.

Stage 02

Design

Our 150-person design practice works out what each audience needs to decide, then designs the data product around that — not around the available fields.

Stage 03

Build

Semantic layer, reporting, self-service and conversational access — built in the tools you already run, against definitions everyone has agreed.

Stage 04

Migrate

Where the baseline justifies it, we consolidate or modernize using a repeatable approach and our own Flash Migrate accelerators — retiring what nobody uses rather than porting it.

Stage 05

Adopt

We run it and we drive usage — enablement, support through D&A operations, and re-measurement against the baseline we started from.

The complete lifecycle approach

Many analytics engagements end at go-live, after Stage 03. The dashboards are delivered, the invoice clears, and whether anyone opens them becomes an internal problem. Stages 04 and 05 are where the adoption number actually moves — and they are the reason we baseline usage before we build anything.

The decision

Dashboard delivery vs. analytics people use

If you are comparing analytics vendors, this is the difference that shows up in the usage logs a year later.

How the two approaches differ across an engagement (typical patterns)
Dimension Project-based dashboard delivery Infocepts: designed and run for adoption
Where it starts Often a requirements list of reports to build. A measured baseline of what exists and who uses it.
What gets migrated Often everything, because usage data is not there to show what is safe to retire. What usage data justifies. The rest is retired, not ported.
Who designs it Typically the BI developer building it, between other tickets. A 150-person design practice working on data products specifically.
Definition of done Typically go-live: the dashboard exists and passes UAT. Usage against the baseline. Delivered and unopened is not done.
Where it ends Typically handover to your team, plus a support SLA. We run it, drive adoption, and re-measure against the baseline.
How success is measured Typically delivery milestones and tickets closed. Active users, report usage, time to insight, estate cost — and the business metric in scope.

Industries

Business analytics for the industries we serve

Industry matters on an analytics engagement because the data sources, the KPI definitions and the regulatory constraints differ — and the semantic layer has to reflect that from the start.

Decisions that turn over weekly, on data arriving faster than definitions can settle.

  • Store and DC operations reporting
  • Demand and supply chain forecasting
  • Brand and margin profitability
  • Marketing mix and promotion analysis

Retail analytics

Proof

Independently rated, not self-declared

4.9Out of 5 · 55 reviews

Gartner®

Gartner Peer Insights

Verified client reviews, as of July 2026. Read the reviews on Gartner.

Highest rated in the category in Gartner’s Voice of the Customer report for Data and Analytics Service Providers, 2022

Databricks Silver Partner · Snowflake Cortex Code Preferred Partner 2026

Recognized in the HFS Challenger Series 2025 for driving scalable enterprise AI

150+ UI/UX and design experts · delivering enterprise reporting since 2004

What this has produced

Retail case study

Retail leader reviewing an executive reporting view

Cutting reporting effort at executive scale

Cut the manual effort behind executive reporting by 30 to 50%.

Retail case study

Retail team reviewing brand profitability

Brand profitability analytics, retail

300+ business users across 43 stores, a 9.5% rise in store profits within a year and $1.5M a year in savings.

Retail case study

Team reviewing a company vitals scorecard

Zero-click company vitals scorecard

Sub-second response, used by 1,000+ employees across teams and countries to track KPIs in real time.

See all case studies across retail, CPG, financial services, media, industrials and life sciences.

Retail leader reviewing analytics on a tablet in a distribution warehouse

The Retail Health Index Scorecard developed by Infocepts revolutionized the way we analyzed and utilized our data. The solution’s real-time insights, presented intuitively, enabled us to monitor key metrics, uncover hidden patterns, and respond promptly.

Global Head, Data & AILeading luxury retailer

Scoped and agreed before work starts

Runs alongside your BI team, not instead of it

A usage-ranked report inventory and a sequenced plan

4.9 / 5 from 55 verified reviews on Gartner Peer Insights

Start here

Find out what you already have

Many organizations find they need less new reporting than they thought, and far more design than they budgeted for. The baseline tells you which.

Or read a case study before you decide.

Questions

Business analytics FAQs

Twelve questions leaders ask before commissioning business analytics work.

Last reviewed October 2026 by the Infocepts Business Analytics practice.

Business analytics services cover the design, build, modernization and ongoing operation of an organization’s analytics and BI estate. At Infocepts this spans four capabilities: enterprise reporting and BI, UI/UX and data product design, conversational analytics, and analytics migration and tool consolidation. The service line includes assessment, delivery and adoption enablement.

Business intelligence usually refers to the reporting and dashboarding layer that shows what happened. Business analytics is broader: it includes BI, but also the design of how people interact with data, natural language access, the migration and consolidation of the tools involved, and the operating model that keeps the estate useful over time. Infocepts delivers both under one service line.

Four measures anchor it — active users, report usage, time to insight and cost of the estate — explained by ten areas scored 1 to 5 across adoption, design, estate and delivery. The output is a usage-ranked report inventory, an estate cost view and a sequenced plan.

We work in the tools you already run, including Power BI, Tableau, Strategy, Looker, Databricks and Snowflake. Switching is a recommendation we make only when the baseline shows a clear cost or capability reason — most often overlapping tool licenses or a legacy platform reaching end of life. If a migration is warranted, it is a defined engagement with its own assessment stage.

Rationalization first. The baseline ranks every report by actual usage, so the migration scope is what people use rather than everything that exists — which is usually a fraction of the inventory. We then migrate in waves using repeatable accelerators, running old and new in parallel for the reports that matter until usage has moved across.

Conversational analytics lets business users query data through voice, text and touch rather than by navigating a dashboard, using NLP and machine learning over a governed semantic layer. It works where the definitions underneath are agreed — which is why we assess the semantic layer before recommending it, not after.

DecideBetter is Infocepts’ decision intelligence approach. It determines which business decisions carry the most value and what data, analytics and AI those decisions require. Business Analytics is the service line that then designs and builds that analytics layer and keeps it adopted. The approach sets the priority; the service line does the work.

By treating it as a design problem rather than a licensing one. Adoption improves when a specific audience can complete a specific task without help, which means designing around the decision rather than the data model, agreeing definitions so nobody has to reconcile two numbers, and retiring the reports that create noise. We measure it before and after against the same baseline.

Yes. Embedded capacity is one of three delivery models. Infocepts specialists work inside your team, to your process and tooling, on a defined capacity rather than a defined project. Teams typically use this to absorb a backlog, cover a skills gap such as semantic modeling or UX, or hold delivery steady through a hiring cycle.

Retail and consumer products, life sciences, media and entertainment, financial services, and manufacturing. Industry matters on a service engagement because the data sources, the KPI definitions and the regulatory constraints differ, and the semantic layer has to reflect that from the start.

On usage and on the business metric behind it, not on delivery milestones alone. Every engagement sets a baseline at assessment covering active users, report usage, time to insight and cost of the estate, and reports against it. Where a business metric is in scope — margin, forecast accuracy or working capital — that is tracked alongside.

Request an Analytics Estate Baseline below, or take thirty minutes with a practice lead first if you would rather scope it. Either way you get a written summary of what the baseline would cover for your organization before any agreement is signed.

Book a Business Analytics Meeting Today

Insights

Related reading

Case Study

Brand Profitability Analytics Improves Retail Profit Margins
Read More

Case Study

Zero-Click Retail Health Index: Real-Time Store KPIs | Infocepts
Read More

ebook

A Practical Guide to Implementing Self-Service Analytics
Read More

ebook

Strategies To Improve Analytics Adoption
Read More

We'd Love to Hear from You!

Open Popup