Services › D&A Operations and Support

D&A operations and support

Data and Analytics Operations and Support

4.9/5

from 55 verified client reviews on Gartner Peer Insights — as of October 2026

We run, support and improve your data and analytics estate, then hand control back when you are ready. We monitor your pipelines and platforms, answer your users’ data questions around the clock, and add or transfer skilled engineers as your needs change.
4.9/5

Gartner Peer Insights, 55 reviews

48%

Typical reduction in annual product support spend

24×7

Data helpdesk coverage

2004

Running enterprise data operations since

Definition

What are data and analytics operations?

Data and analytics operations is the work of keeping data pipelines, platforms, reports and models reliable, supported and cost-controlled after they go live: monitoring, incident response, user support, release and change management, and cost control.

Infocepts runs it for enterprise teams on the platforms they already own, including Databricks, Snowflake, Power BI, AWS and Azure, in seven separately scoped services you can engage individually or together.

The distinction that matters at procurement is the exit. A traditional outsourcing contract has no designed endpoint. A Build-Operate-Transfer engagement does: we build the capability, run it, and transfer it to your team on an agreed date, with the talent and the runbooks going with it.

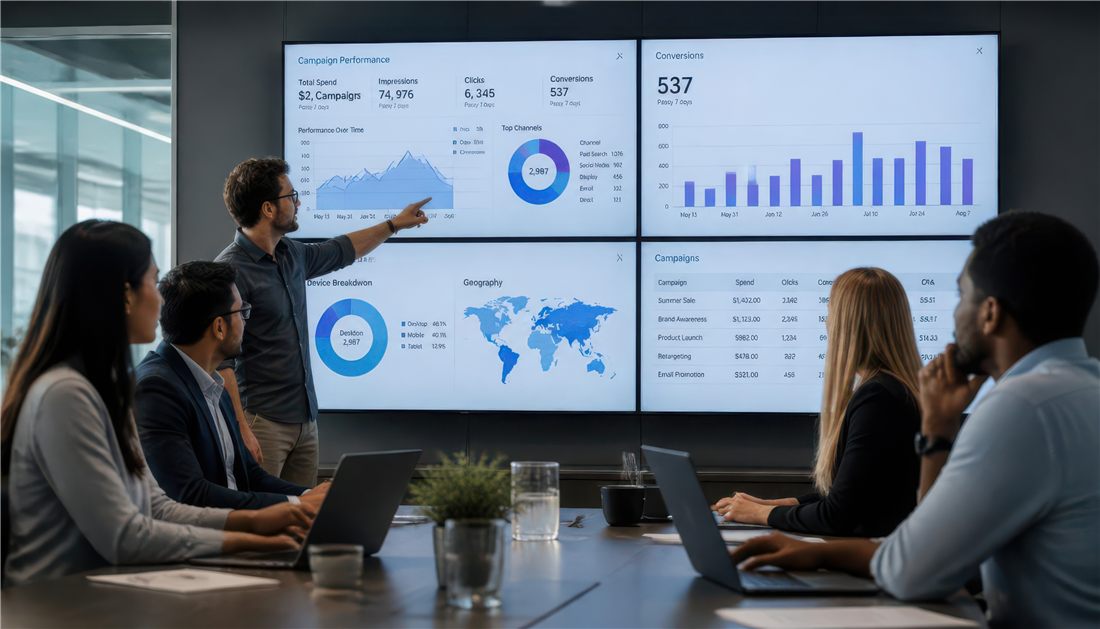
A team reviewing data and analytics dashboards on a wall of screens

Most data and analytics spend is not in the build. It is in running, supporting and paying for the estate afterwards. A platform is built once and run for years, and how it is run decides what it costs and how reliable it is.

Infocepts point of view

Managed services vs. staff augmentation

Staff augmentation buys you people, managed under your process, measured on hours. Managed services buys you an outcome — availability, resolution times, cost — measured on service levels, with the staffing model our problem rather than yours. Infocepts offers both: Elastic Capacity for the first, Managed Services for the second.

What Build-Operate-Transfer means here

We source and develop the data and analytics talent, run the function to an agreed standard, then transfer the team and the capability into your organization. It suits companies building an in-house capability who need it operating before they can hire for it. See Build-Operate-Transfer.

The problem

Signs your data and analytics operations need support

Four symptoms we hear most from enterprise teams that already run a data and analytics platform. Each maps to an operating model.

01

Hiring takes months and one person holds the run model

The people who can run a modern data estate are the same people every other employer wants. Hiring takes months, attrition resets it, and the run model depends on individuals rather than on documented practice. See Build-Operate-Transfer.

02

Support renewals are never questioned

High-cost, low-value support agreements from analytics product firms are renewed because nobody has modeled the alternative. Clients who moved to Enterprise Product Support have typically cut annual support spend by around 48 percent; the saving depends on the agreement you start from.

03

Capacity is idle between surges and short during them

Data initiatives surge and subside. A team sized for the peak is idle between them; a team sized for the average delays every decision that arrives during one. Elastic Capacity flexes with the demand.

04

The same tickets and requests come back every week

The same incidents, the same report reruns, the same access requests. Automating them is always next quarter’s project, because this quarter’s team is occupied doing them by hand. Our data helpdesk and managed services take that queue.

Where the real problem is the estate itself rather than how it is run — a platform at end of life, or reporting nobody opens — that is a data modernization or business analytics question, and the baseline will say so rather than selling you a support contract.

Services

Complete data lifecycle support

A full suite of services, from data collection and analysis to training, support, and custom application development. Engage any one independently, or run the whole function through us.

01

Managed Services

Infocepts Managed Services addresses the challenges of modern data and analytics demands by going beyond traditional outsourcing models. AI-driven solutions automate and optimize your entire data lifecycle, with us accountable for the outcome rather than the hours.

02

Build-Operate-Transfer

We source and develop top data analytics talent, run the function, and transfer it to you. Our talent network spans cloud, data engineering, analytics, automation and AI — so the capability exists before you have to hire for it.

03

Data Helpdesk

24×7 personalized support for data interpretation, report visualization and metric definition. Our experts work with your team so that accurate, reliable information underpins decisions rather than another round of reconciliation.

04

Elastic Capacity

Access to a versatile talent pool tailored to project demand. An as-a-service model giving immediate access to specialized expertise, with the flexibility and scale that teams with changing requirements need.

05

Enterprise Product Support

A flexible alternative to the high-cost, low-value support agreements analytics product firms typically offer. Experienced data and analytics engineers, unbiased guidance based on best practice, and clients typically reducing annual support spend by around 48 percent, depending on the starting agreement.

06

Custom Support

An extension of your team, applying data and AI analytics expertise to sustainable growth and adoption. Focused on enterprise processes, technology and transformation, with consultants who have run these estates before.

07

D&A Training

Tailored training that prepares your team to get full use of data analytics tools and applications. Software, data and process training in classroom, e-learning or hybrid formats, customized to your requirements, to lift adoption and return on existing investment.

Not sure which applies?

Many engagements begin with the operations baseline, because a ticket profile and a run-cost figure help settle the build-versus-buy question early. Thirty minutes with a practice lead will tell you whether that applies to you.

The baseline

Operations Baseline

Four measures map onto the four pressures above. Ten scored areas explain them. The output is a run-cost view and a ranked list of what can be automated — before any transition begins.

An analytics lead working on a laptop late in the day

M1Ticket profile — volume, type, and mean time to resolve

M2Run cost — support contracts, licenses, and consumption spend

M3Availability — uptime, failed jobs, and the incidents users actually feel

M4Skills coverage — where the run model depends on one person

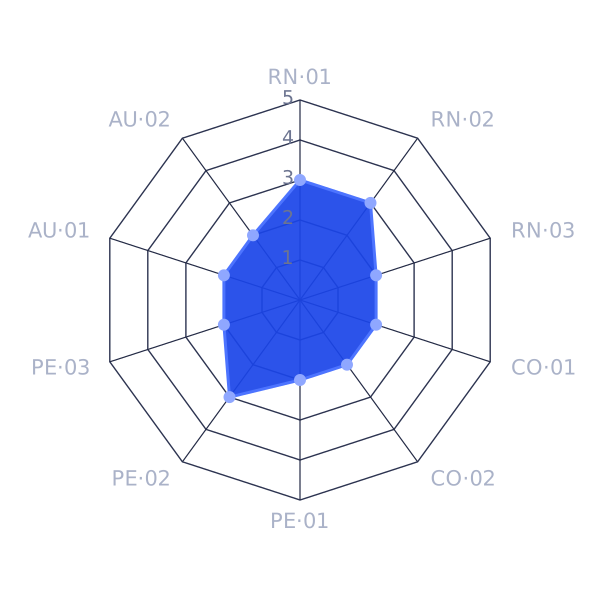
Ten areas, scored 1–5Maturity scale:1 Ad hoc2 Repeatable3 Defined4 Managed5 Optimized

RN·01Dimension 1 · 3 areas

Monitoring and alerting

Whether failures are detected by the system or reported by the user who hit them.

Sample 3

RN·02Dimension 1 · 3 areas

Incident and resolution

How tickets are triaged, routed and resolved, and whether the same ones recur.

Sample 3

RN·03Dimension 1 · 3 areas

Availability and service levels

Whether service levels exist, are measured, and match what the business needs.

Sample 2

CO·01Dimension 2 · 2 areas

Support and license spend

What product support and licensing cost against the value they return.

Sample 2

CO·02Dimension 2 · 2 areas

Cloud consumption management

Whether consumption is monitored and controlled, or discovered on the invoice.

Sample 2

PE·01Dimension 3 · 3 areas

Skills coverage

Where the run model depends on a single person, and what happens when they leave.

Sample 2

PE·02Dimension 3 · 3 areas

Capacity elasticity

How quickly capacity flexes when demand surges, and what it costs when it subsides.

Sample 3

PE·03Dimension 3 · 3 areas

User enablement and training

Whether users are equipped to self-serve, or trained to raise a ticket.

Sample 2

AU·01Dimension 4 · 2 areas

Automation of routine work

What share of recurring tickets could be resolved without a human touching them.

Sample 2

AU·02Dimension 4 · 2 areas

Knowledge and runbooks

Whether the run model is documented well enough to transfer to another team.

Sample 2

What the output looks like

Your Operations Baseline Score on one view

All ten areas on one view. The profile below is an illustrative sample, not client data.

Sample operations baseline scoreIllustrative

A ten-axis radar chart showing an illustrative data operations maturity profile scored one to five, with values listed in the table beside it

Illustrative sample profile · scored 1–5 · not client data

2.3Overall operations score out of 5 · illustrative

  • RN·01Monitoring and alertingDefined3
  • RN·02Incident and resolutionDefined3
  • RN·03Availability and service levelsRepeatable2
  • CO·01Support and license spendRepeatable2
  • CO·02Cloud consumption managementRepeatable2
  • PE·01Skills coverageRepeatable2
  • PE·02Capacity elasticityDefined3
  • PE·03User enablement and trainingRepeatable2
  • AU·01Automation of routine workRepeatable2
  • AU·02Knowledge and runbooksRepeatable2

The shape to look for is monitoring and incident handling at 3 with automation and runbooks at 2. That team is good at responding and has never been given time to stop responding. It is also the profile where a transition tends to pay for itself fastest, because the recurring ticket volume is the first thing to automate away.

What you get

An operations score across all ten areas, a ticket profile, a run-cost view across support and consumption, and a ranked list of automation candidates.

How it runs

Alongside your current support model rather than interrupting it, and scoped to the size of your estate.

What happens next

A transition plan with service levels, a cost comparison against today, and an agreed transfer date if you want one.

The method

How we take over, run, and hand back

Five stages. The fifth is optional, and it is the one many providers do not offer.

Stage 01

Baseline

Score the ten areas, profile the tickets, and establish the run-cost figure the engagement will be measured against.

Stage 02

Transition

Knowledge capture, runbooks, shadowing and reverse-shadowing. Your team stays in control while we learn the estate.

Stage 03

Stabilize

We take the run. Monitoring, 24×7 helpdesk, incident response and product support against agreed service levels.

Stage 04

Optimize

Automate the recurring work, renegotiate or replace high-cost support contracts, and manage consumption through Cloud FinOps. Run cost falls against the baseline.

Stage 05

Transfer

Optional. Under Build-Operate-Transfer, the team, the runbooks and the capability move into your organization on an agreed date.

A designed exit

Many managed services contracts have no designed exit, because the provider’s commercial interest is in there not being one. Stage 05 is optional and it is real — the talent, the documentation and the capability transfer to you. A provider that cannot describe its own exit is telling you something about the contract.

Platform

HyperCare: the platform underneath

Efficient, cost-controlled D&A operations. HyperCare is how the run model is instrumented, so cost reduction is demonstrated against the baseline rather than asserted at renewal.

A glowing cloud above a circuit board

Cloud FinOps

Consumption monitoring and cost control across the cloud data estate.

  • Consumption tracking by workload
  • Cost anomaly alerting
  • Optimization recommendations

A data center aisle with streaming light

D&A Managed Services

The delivery platform behind the managed services engagement.

  • Monitoring and alerting
  • Incident and ticket workflow
  • Service level reporting

Glowing data cubes on a dark field

Automated Quality Analyzer

Continuous data quality checks so issues surface before users do.

  • Automated validation
  • Pipeline monitoring

A cloud icon over a glowing data network

Cloud Cost Monitor

Consumption visibility from day one of the engagement, not at renewal.

  • Spend tracking
  • Budget alerting

A checkmark chip on a circuit board

QAgentic

Autonomous QA across the data estate, reducing manual regression effort.

  • Automated test coverage
  • Continuous validation

Operating models

Choose how Infocepts operates with you

Which model fits depends on who should carry staffing risk, how quickly demand changes, and how the engagement should end. Several can run together.

How the operating models differ (typical patterns)
Model Best for Who staffs it How it ends
Managed Services Teams that want an outcome against service levels, not hours. Infocepts, accountable for coverage and attrition. Renewal, or transfer under Build-Operate-Transfer.
Data Helpdesk Business users blocked on metric definitions, report errors and data interpretation. Infocepts data and analytics experts, 24×7. Ongoing, scope reviewed with you.
Build-Operate-Transfer Companies building an in-house data function that cannot hire fast enough. Infocepts builds and runs it, then transfers it. Team, runbooks and capability transfer to you on an agreed date.
Elastic Capacity Teams with surging or changing demand for specialist skills. Infocepts talent, flexed up and down under your direction. Capacity scales back when the surge ends.
Enterprise Product Support Estates paying for high-cost vendor support agreements. Infocepts data and analytics engineers. Agreed per contract, reviewed against your current vendor agreement.
Custom Support Needs the standard models do not cover. Infocepts consultants as an extension of your team. Scoped per engagement.

Industries

Where we run operations

Run models differ by sector because the business calendar, the regulatory obligation and the cost of an outage differ.

Peak trading periods where an overnight job failure is a lost trading day.

  • Peak-season coverage
  • Store and supply chain reporting
  • Seasonal capacity flex

Retail

Proof

Independently rated, not self-declared

4.9Out of 5 · 55 reviews

Gartner®

Gartner Peer Insights

Verified client reviews, as of October 2026. Read the reviews on Gartner.

Highest rated in the category in Gartner’s Voice of the Customer report for Data and Analytics Service Providers, 2020, 2021 and 2022

Databricks Silver Partner · Snowflake Cortex Code Preferred Partner 2026

Recognized in the HFS Challenger Series 2025 for driving scalable enterprise AI

97.2% client retention · running enterprise data operations since 2004

What this has produced

Financial services case study

A managed data and analytics program serving a large bank

Scale and optimize data analytics operations with HyperCare

A managed D&A program scaled adoption 8X to support 40,000+ users, with an 80% reduction in tickets per month and 100% SLA compliance.

Automation case study

Automation of a recurring manual reporting process

Accelerate client onboarding with intelligent automation

Automating report and dashboard generation saved over $1M in annual costs and cut report delivery from two weeks to one day.

Industrials case study

Snowflake cost optimization results

Snowflake cost optimization for a manufacturer

$43,686 in annual savings from warehouse tuning, right-sizing and Time Travel governance, with performance held steady.

See all case studies across retail, CPG, financial services, media, industrials and life sciences.

A data leader reviewing analytics on a tablet in a distribution warehouse

Infocepts takes away a lot of the headaches of managing an Analytics team and allows me to focus on delivering more value-adds to our business sponsors.

Senior Director of Analytics, Consumer BankingGlobal Commercial Bank

A run-cost baseline before any commitment

Service levels agreed, measured and reported

Build-Operate-Transfer when you want it back

4.9 / 5 from 55 verified reviews on Gartner Peer Insights

Start here

Ready to transform your D&A operations?

Start with a run-cost figure rather than a proposal. It runs alongside your current support model, and you keep the findings either way.

Or read 6 reasons organizations need managed data and analytics services.

Procurement

How to evaluate a managed services partner

Six questions that separate proposals quickly. Ask every bidder, including us.

01

What happens to their revenue if they automate?

If automating your recurring tickets reduces their billing, it will not happen. Ask how the contract handles it.

02

Can they describe the exit?

A provider that cannot describe how you would leave has not designed for it. Ask for the transfer mechanism in writing.

03

Who carries attrition risk?

Ask what happens to your service levels when their named lead resigns — and whether that answer is contractual.

04

Is product support reviewed or renewed?

Vendor support agreements are a large, rarely examined line. Ask whether reviewing them is in scope.

05

How does capacity flex?

Fixed teams fail in both directions. Ask how capacity moves up for a surge and down afterwards.

06

What is measured, and against what?

Ask for a baseline before transition. Without one, every later cost claim is unverifiable.

An operations analyst studying monitoring dashboards on large screens

Questions

D&A operations FAQs

Fifteen questions leaders ask before commissioning data and analytics operations support.

Last reviewed October 2026 by the Infocepts D&A Operations practice.

Data and analytics operations is the work of keeping data pipelines, platforms, reports and models reliable, supported and cost-controlled after they go live: monitoring, incident response, user support, release and change management, and cost control. Infocepts runs it for enterprise teams, and you keep strategy and decision rights.

The ongoing operation of an enterprise’s data and analytics estate by an external partner, with the partner accountable for availability, resolution times and run cost against agreed service levels. It is one of seven operating models Infocepts offers; see data analytics managed services.

Staff augmentation supplies people who work under your management and process, measured on hours delivered. Managed services supplies an outcome measured on service levels, with staffing, coverage and attrition the provider’s obligation. Infocepts offers both — Elastic Capacity for augmentation, Managed Services for the outcome model — and the operations baseline usually makes clear which one the situation calls for.

Build-Operate-Transfer is a three-phase engagement: the partner sources and develops the talent and builds the capability, operates it to an agreed standard, then transfers the team and the capability into the client’s organization on an agreed date. It suits companies building an in-house data function that need it running before they can realistically hire for it. The transfer is designed in from the start rather than negotiated at the end.

Three levers drive it: automating recurring ticket volume, reviewing product support agreements against alternatives, and managing cloud consumption. On product support specifically, clients who moved to Infocepts Enterprise Product Support have typically cut annual support spend by around 48 percent, depending on the agreement they started from. Total run-cost reduction depends on your starting point, which is what the operations baseline establishes before any commitment.

Four measures — ticket profile, run cost, availability, and skills coverage — explained by ten areas scored 1 to 5 across run, cost, people and automation. The output is a run-cost view, a ranked list of automation candidates, and a transition plan. It runs alongside your current support model rather than interrupting it.

In stages, with overlap. Knowledge capture and runbook creation happen first, then shadowing, then reverse-shadowing where we handle tickets with your team observing. Your team stays in control throughout and hands over by service area rather than all at once. The baseline taken before transition is what later performance is measured against.

Yes. Operations run on the estate you have, whether that is Power BI managed services, Snowflake managed services or Databricks managed services: Power BI, Tableau, Strategy, Databricks, Snowflake, Microsoft Fabric, AWS and Azure among them. Where the baseline shows a platform is the actual cost driver rather than the run model, we say so, and that becomes a data modernization conversation rather than a support contract.

Service levels are set per engagement against the baseline and the business impact of each service area — a regulatory reporting cycle and an internal dashboard do not warrant the same response commitment. The Data Helpdesk operates 24×7. Specific response and resolution targets are agreed during transition and reported against monthly.

Yes, and it is a designed stage rather than a contractual dispute. Under Build-Operate-Transfer the team, the runbooks and the capability transfer to you on an agreed date. Even outside a BOT engagement, documentation and runbooks remain your property, which is one of the ten areas the baseline scores.

A data helpdesk answers business users’ questions about metric definitions, report errors and data interpretation, so analysts are not pulled into the queue. Teams need one when the same questions keep reaching the data team. Infocepts runs it 24×7; see data helpdesk.

Ask four things: who carries staffing and attrition risk, how the contract treats automation, how capacity flexes when demand changes, and how the arrangement ends. A provider that cannot describe its exit has not designed for one. The procurement questions above are the same ones we expect to be asked.

HyperCare is the Infocepts platform behind D&A operations, covering managed services delivery and Cloud FinOps. It instruments monitoring, ticket workflow, service level reporting and consumption tracking, so cost reduction can be demonstrated against the baseline rather than asserted at renewal.

Retail and consumer products, life sciences, media and entertainment, financial services, and manufacturing. Sector matters because the business calendar, the regulatory obligation and the cost of an outage differ — a validated life sciences environment and a retail peak-trading period need different change control and different coverage windows.

Start with the operations baseline, or take thirty minutes with a practice lead first if you would rather scope it. Either way you get a written summary of what the baseline would cover, and a run-cost figure to compare against, before any agreement is signed.

Ready to Transform your D&A Operations?

Insights

Insights & Resources

ebook

Data-Driven Automation: A Business Ethos, Not a Project

Read More

Case Study

Scale & optimize data analytics operations with Infocepts Hypercare

Read More

Case Study

Accelerate new client on-boarding with Intelligent Automation

Read More

Blog

6 Reasons why organizations need managed data and analytics services

Read More

We'd Love to Hear from You!

Open Popup