

Organizations rely on their data platforms every moment of the day — from powering customer interactions to guiding financial decisions. Due to criticality of the systems, when something slows down, fails, or changes unexpectedly, the impact is felt fast. That’s why teams must always know what’s happening across their operations — before issues begin to affect users, decisions, or compliance.
As workloads, SQL performance, governance demands, and AI adoption continue to expand, organizations need a way to:
- Understand what’s driving cost changes
- Ensure the Lakehouse remains healthy and compliant
- See where delays and failures are built
- Monitor AI usage and its real‑world impact
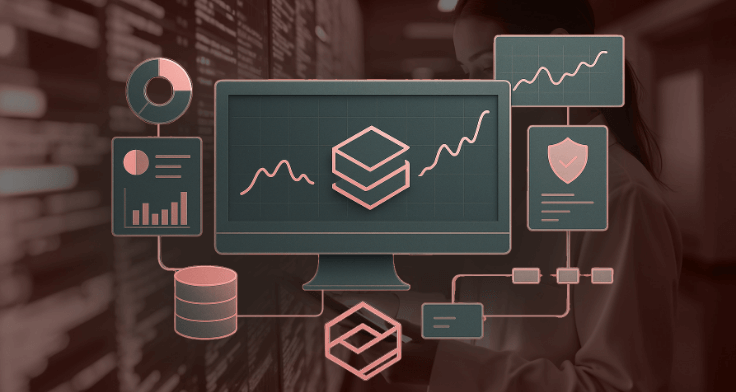
Databricks Lakehouse Observability brings all these capabilities into one governed place — inside the Lakehouse.
Databricks powers data engineering, analytics, and AI together — so observability must live there too. Monitoring within the Lakehouse means:
- Unity Catalog makes Observability governed by design
Because governance is built into the Lakehouse, the Observability framework does not require separate permissions or controls — it remains consistent and secure as more assets are monitored. - Near real-time Lakehouse operations make Observability more responsive
Observability continuously reflects platform behavior without extra syncing or data movement — reducing maintenance effort and keeping insights up to date as workloads grow. - Built-in lineage makes Observability inherently impact-aware
The Observability framework automatically understands relationships between its own monitored assets — reducing manual configuration and staying organized as the Lakehouse evolves.
The Benefits of Comprehensive Observability
Observability isn’t just about watching systems run—it’s about understanding what’s changing and why it matters. Databricks Lakehouse Observability helps teams stay ahead of issues that impact performance, cost, compliance, and AI outcomes before they affect the business.
- Protect business performance at peak times
Identify pipeline slowdowns that would delay executive dashboards during business hours. - Avoid budget shocks
Spot cost anomalies mid‑cycle — instead of at month‑end — and take action immediately. - Maintain trusted and compliant data
Get alerts when Lakehouse structures grow unexpectedly or when PII policies impact usage. - Improve AI service quality
Track user usage trends, model responsiveness, and adoption patterns to enhance value. - Shorten recovery time
One source of truth means faster root‑cause analysis and fewer disruptions.
These outcomes help organizations deliver reliable data, predictable cost, and confident AI adoption.
Databricks already provides strong platform signals — including detailed cost reporting, usage dashboards, and operational telemetry. These help teams understand how compute resources are being consumed and where spend is trending across workloads.
However, organizations still need more than visibility into billing. They need clarity on what is driving changes, who is impacted, and how to respond — in real time. Infocepts has engineered an observability solution fully aligned with the Databricks Lakehouse — no extra tools or complex setup.
It provides a complete operational picture so teams can:
- See a problem before it becomes an incident
E.g.: Detect pipeline performance degradation before dashboards refresh for leadership. - Understand cost changes with real evidence
E.g.: Track sudden warehouse scaling tied to a specific job release. - Resolve issues without searching through tools
E.g.: Find exactly which schema change caused an AI feature to break.
The Infocepts solution organizes observability around the operational signals that matter most to enterprise teams, ensuring insights remain relevant, actionable, and aligned to business outcomes.
| Focus Area | What It Enables |
|---|---|
| Cost & Pricing | Cost transparency, usage insights, and spend predictions to avoid cost overruns |
| Workflow & SQL Performance | Early detection of slowdowns, failures, and retry patterns to protect SLAs |
| Lakehouse Monitoring & PII Governance | Insight into schema changes, storage growth, and PII controls to reduce risk |
| AI Monitoring | User activity, model behavior analysis, and trend intelligence for better user experience |
With both visibility and context, teams move beyond reacting to incidents and toward preventing them altogether.
The Infocepts observability solution for Databricks is designed to deliver deep operational insight without introducing additional complexity or operational overhead. Built entirely on Databricks-native capabilities, the architecture ensures observability remains reliable, scalable, and secure as Lakehouse adoption grows.
- Unified platform signals capture activity across compute resources, pipeline execution, storage growth, user behavior, and AI usage—providing a single, consistent operational view without relying on external monitoring tools.
- Feature Store integration enables accurate analysis of performance trends, usage patterns, and cost movements over time, supporting forecasting and informed capacity planning.
- Guided intelligence experiences, including Genie, AI/BI dashboards, and Copilot chat, add context and recommended actions—helping teams quickly understand issues and respond effectively.
- Governed execution through Unity Catalog ensures all observability insights adhere to enterprise security and access controls, giving stakeholders confidence that the right users see the right signals.
This architecture scales naturally with the Lakehouse, enabling organizations to operationalize observability as a continuous, enterprise-ready capability.
To be effective at enterprise scale, observability must go beyond visibility and enable teams to act with speed and confidence. The Infocepts observability solution addresses this by embedding insights directly into how teams monitor, investigate, and respond to Lakehouse behavior.
- AI/BI Genie Dashboards embedded in our solution translates Databricks-native signals into clear, impact-aware views of change across the Lakehouse. Teams can trace issues to their precise source, understand downstream effects, and securely share insights within governed access boundaries.
- AI-powered Data App chat experiences we have enabled in the solution allows users to engage with observability conversationally—asking operational questions, reviewing context and explanations, and receiving guided next steps without navigating multiple tools or raw metrics.
By delivering insights through these integrated experiences, Infocepts solution ensures every action is informed by a single, consistent view of operational truth—helping organizations move from monitoring to meaningful intervention.
Infocepts Databricks Lakehouse Observability solution enables organizations to fully operationalize observability within the Databricks platform itself. Our architecture leverages Databricks-native telemetry, metadata, lineage, and governance signals to deliver a trusted, end-to-end view of cost, performance, data health, and AI usage—without introducing external observability systems.
Infocepts solution structures these Databricks signals into a cohesive observability layer that helps teams not only see what is happening in their Lakehouse, but also understand impact, root cause, and operational risk in real time. By using Unity Catalog–governed assets and built-in lineage, observability insights remain secure, consistent, and context-aware as workloads and users scale.
Through Databricks-native dashboards, guided analytics, and conversational experiences, Infocepts enables proactive monitoring and faster resolution of pipeline slowdowns, SQL performance degradation, cost anomalies, schema changes, and AI usage shifts. This shifts operations from reactive troubleshooting to predictable, evidence-driven Lakehouse management.
Infocepts delivers Databricks observability the way it is meant to be—native, governed, and impact-aware—providing one trusted operational view across the entire Lakehouse. By keeping observability entirely inside Databricks, the Infocepts architecture ensures:
- Reliable performance across data and AI workloads
- Transparent and explainable cost behavior
- Continuous visibility into Lakehouse health and governance
- Confident, measurable AI usage
Ready to operationalize observability in your Databricks environment? Our experts can help you establish a scalable, governed framework tailored to your business priorities.
Connect with our Lakehouse team to schedule a discovery session or request a demo of our Observability solution.
Abhijit Sarkar is a Databricks Solution Champion, Practice Lead, and Azure Cloud Solution Architect with 16+ years of experience in data engineering and modern Lakehouse platforms.
Read Full BioAkash Wadhankar is a Data & AI leader and Databricks Solution Architect, focused on building modern lakehouse and agentic AI platforms at scale. He works at the intersection of data engineering...
Read Full BioRecent Blogs

No More Manual Audits – Achieve Perfect Planogram Compliance with AI
March 3, 2026
From Overstock to Optimized – The Shift from Buffer-Based Planning to AI Precision
March 2, 2026
End Stockouts for Good – How AI Keeps Retail Shelves Full
March 1, 2026

From Insight to Intent: How Mosaic + Agent-AI Unlock Scalable, Repeatable Growth
February 27, 2026