


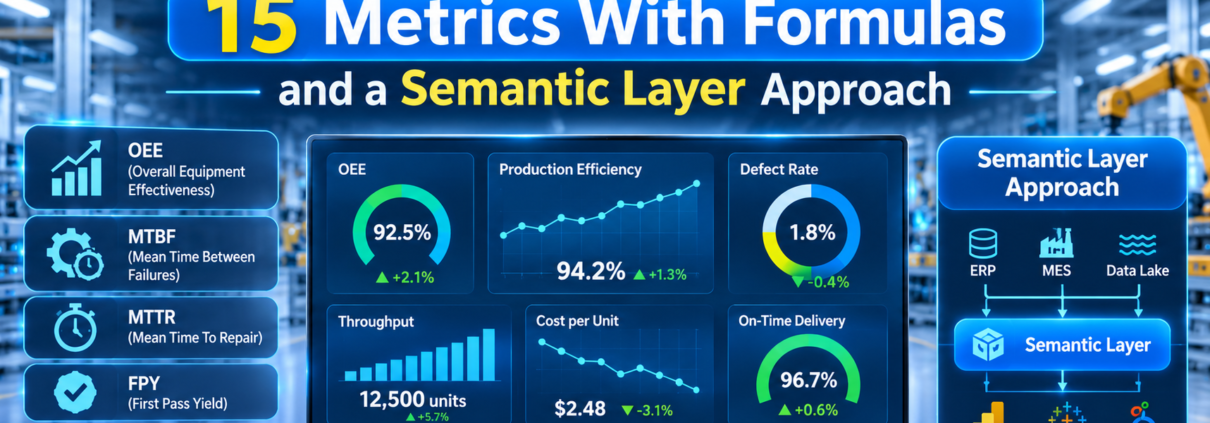
Manufacturing KPIs: 15 Metrics With Formulas and a Semantic Layer Approach
Manufacturing KPIs are the measures plants use to track productivity, quality, delivery, cost, safety and reliability. A KPI is only useful if everyone calculates it the same way. That second sentence is where most programs struggle, and it is the reason this guide pairs the formulas with a way to keep them consistent.
Ask three plants in the same company for OEE and you may get three numbers built on three definitions of planned time. Ask two regions for on-time delivery and one may measure against the requested date and the other against the confirmed date. Dashboards built on these figures look authoritative and settle nothing. The fix is less about better charts than about defining each metric once and using it everywhere.
Fifteen KPIs by area
Productivity and flow
| KPI | Formula | Notes |
|---|---|---|
| OEE | Availability × Performance × Quality | Define planned time and ideal cycle time. See our OEE guide |
| Throughput | Good units ÷ time period | Count only good units |
| Cycle time | Time to complete one unit at a step | Distinguish ideal from actual |
| Takt time | Available production time ÷ customer demand | Pace needed to meet demand |
| Schedule adherence | Orders completed as planned ÷ orders planned | Planning reliability |
Quality
| KPI | Formula | Notes |
|---|---|---|
| First pass yield | Units passing first time ÷ units entering | Excludes rework |
| Rolled throughput yield | Product of FPY across steps | Reveals compounding loss |
| Scrap rate | Scrapped units ÷ total units produced | Report by cause and cost |
Reliability and maintenance
| KPI | Formula | Notes |
|---|---|---|
| MTBF | Operating time ÷ number of failures | Applies to repairable assets |
| MTTR | Total repair time ÷ number of repairs | Include diagnosis and waiting for parts if you want the full picture |
| Planned maintenance percentage | Planned maintenance hours ÷ total maintenance hours | Indicator of maintenance maturity |
Supply chain and cost
| KPI | Formula | Notes |
|---|---|---|
| OTIF | Orders on time and in full ÷ total orders | Define window and tolerance |
| Inventory turns | Cost of goods sold ÷ average inventory | Higher usually means leaner |
| Energy intensity | Energy used ÷ units produced | Normalize for mix |
Safety (one metric to start)
| KPI | Formula | Notes |
|---|---|---|
| Total recordable incident rate | (Recordable incidents × 200,000) ÷ hours worked | 200,000 equals 100 full-time workers for a year; confirm the definition against OSHA guidance for your jurisdiction |
This is a starting set, not a complete one. Add metrics only when someone will use them to decide something.
A worked example across three KPIs (illustrative)
A plant has 450 minutes of planned production per shift and customer demand of 360 units per shift.
Takt time = 450 minutes ÷ 360 units = 1.25 minutes per unit
A line with a cycle time of 1.4 minutes cannot meet demand on one shift without overtime or an additional line. The line produced 330 units, of which 313 were good first time and 8 were scrapped (with the rest reworked).
First pass yield = 313 ÷ 330 = 94.8 percent Scrap rate = 8 ÷ 330 = 2.4 percent
Each figure tells a different part of the story: the line is too slow for demand, about 5 percent of units need rework, and a smaller share is scrapped. A single score would blur all three.
Why definitions drift
Metrics drift for ordinary reasons.
- Local needs. A plant adds a category of exclusions to make its numbers fit its context.
- Different systems. MES, ERP and spreadsheets each calculate the same KPI with their own logic.
- Time. Someone changes a rule and the trend line quietly breaks.
- Acquisitions. New plants arrive with their own conventions.
- Spreadsheet copies. Each copy of a formula can diverge.
The result is that executives lose trust in the numbers, and analysts spend their time reconciling rather than analyzing.
What a semantic layer does
A semantic layer is a governed set of business definitions that sits between source data and the tools people use. For manufacturing, it holds the definition of each KPI, the sources it draws from and the rules for calculating it, so a dashboard, a report, a model or a plain-language question all draw on the same logic.
| Without a semantic layer | With a semantic layer |
|---|---|
| Each team writes its own OEE formula | One OEE definition, versioned and shared |
| Numbers differ between reports | Reports agree because they share the logic |
| Changes ripple unpredictably | Changes are made once and tracked |
| New dashboards start from scratch | New dashboards reuse approved metrics |
| AI assistants guess at definitions | AI answers use governed definitions |
The last row matters more as plants adopt natural-language questions and AI agents. An assistant asked “what was OEE on line 4 last week?” needs a single, auditable answer to what OEE means. Without governed definitions, it will produce a confident figure that nobody can reproduce.
How to build a KPI dictionary
- List the decisions. Which decisions are made weekly, monthly and quarterly, and by whom?
- Select the KPIs that inform those decisions. Cut the rest.
- Write the definition for each: formula, inputs, units, time period, inclusions and exclusions.
- Name the source. Which system is the system of record for each input?
- Assign an owner who approves changes.
- Version it. Record when and why a definition changed, so trends can be interpreted.
- Test with real data from at least two plants, and resolve differences before publishing.
- Publish it where people work, not in a document nobody opens.
Entries should include: name, purpose, formula, inputs and sources, unit, grain (by line, shift, plant), refresh frequency, owner, version and known limitations.
Organizing data for plant-wide consistency
KPI consistency depends on consistent data structure. Many manufacturers organize equipment and production data using the ISA-95 hierarchy (enterprise, site, area, line, cell), so a KPI can be calculated at any level using the same logic. Master data for assets, products and materials must be managed so the same machine or part has one identity across systems. This work is less glamorous than analytics, and it decides whether analytics can scale to the second plant.
A sample dictionary entry
Here is how one entry might look. The content is illustrative and should be adapted to your plant.
| Field | Entry |
|---|---|
| Name | On-time in-full (OTIF), customer |
| Purpose | Measure delivery reliability to customers |
| Formula | Orders delivered on or before the confirmed date and at 100 percent of confirmed quantity ÷ total orders due in the period |
| Inputs and sources | Order lines (ERP), shipment confirmations (WMS or TMS), confirmed dates (order management) |
| Grain | Order line; reportable by customer, product family, plant and week |
| Exclusions | Orders cancelled by the customer before the confirmed date |
| Tolerance | None for quantity; same day for date |
| Owner | Head of supply chain |
| Version | 1.2, effective on a stated date; version 1.1 allowed a quantity tolerance of 2 percent |
| Known limitations | Partial shipments recorded late in the warehouse system can lower the figure |
The version and limitation rows are the ones teams tend to skip, and they are the ones that save an argument six months later.
Common mistakes
- Choosing too many KPIs, so nothing gets attention.
- Setting targets before agreeing definitions.
- Reporting averages across plants that hide variation.
- Treating a KPI as a performance score for individuals when it was designed as a process diagnostic.
- Changing a formula without versioning it.
- Building dashboards before the dictionary, then retrofitting definitions.
Where Infocepts fits
Infocepts describes its AI Semantic Layer as a governed set of more than 200 pre-built manufacturing KPIs, such as OEE, MTBF, OTIF and scrap rate, each defined once, versioned and auditable across plants and systems. Every agent in its manufacturing platform draws from that layer. See the Infocepts manufacturing page for the full set of agents, and our deeper guides on OEE, predictive maintenance, yield optimization, supply chain resilience and energy management.
FAQ
What are the most important manufacturing KPIs?
It depends on goals, but most plants track OEE, first pass yield, scrap rate, on-time in-full delivery, MTBF and MTTR, and a safety measure.
How do you calculate takt time?
Divide available production time by customer demand for the same period.
What is the difference between MTBF and MTTR?
MTBF measures how long equipment runs between failures. MTTR measures how long a repair takes.
What is a semantic layer in manufacturing?
A governed set of KPI and data definitions that all reports, dashboards and AI tools share, so every user gets the same answer to the same question.
How many KPIs should a plant track?
Enough to run the business and few enough that people know them. Tie each to a decision and an owner.
How do I stop KPI definitions from drifting?
Assign owners, version every change and calculate metrics in one governed layer rather than in each report.
Recent Blogs



The Enterprise AI & Data Transformation Partner. Delivering measurable business impact globally.
#1 on Gartner Peer Insights · 97.2% client retention