


In short: cross-media measurement shows how many different people an ad reached across TV, streaming and digital, and what they did next. For publishers, the hard part is that every measurement vendor reports a different number. The fix is to normalize those numbers into one agreed view before the pitch, not after the complaint.
In this guide
- What is cross-media measurement?
- How cross-media measurement works: five building blocks
- Why publishers cannot simply pick one currency
- The One-Number Method: four steps to reconcile currencies
- Worked example: three vendors, one campaign
- How to choose a cross-media measurement tool: six questions for a vendor
- A real example: a Big 3 TV network
- Where Infocepts fits
- Frequently asked questions
What is cross-media measurement?
Cross-media measurement counts an audience, and the results of an ad campaign, across more than one channel, such as linear TV, streaming, digital and social. You will also see it called cross-platform, cross-channel, cross-screen or omnichannel measurement. A good cross-media measurement tool does three jobs. It counts each person once, which is deduplicated reach. It applies the same definitions everywhere. And it connects exposure to outcomes.
Three groups rely on it. Advertisers and agencies use it to plan budgets and judge results across screens. Publishers and networks use it to prove what they delivered and to justify their price. Vendors and industry bodies use it to set the shared rules everyone else depends on. A single platform’s report cannot do this job, because it cannot see the person who watched the same ad on two screens. The rest of this guide takes the publisher’s seat.
Advertisers have asked for this for years. Industry checklists call for common definitions and auditable deduplication methods (checklist), and the IAB’s cross-channel playbook names data silos, attribution complexity and privacy as the main hurdles (IAB). For the wider discipline, see our glossary on media measurement and attribution.
How cross-media measurement works: five building blocks
Every cross-media measurement tool is built from some mix of these five parts. Knowing which ones a vendor uses tells you what its numbers can and cannot prove.
| Building block | What it does | Watch out for |
|---|---|---|
| Panel measurement | Estimates audiences from a sample of households | Familiar and accredited, but thin for niche audiences |
| Big data and ACR | Uses viewing data from smart TVs and set-top boxes at scale | Coverage varies by device and data provider |
| Identity graph | Links the same person across devices and platforms | Makes deduplication possible, but match rates vary |
| Data clean room | Matches audiences and outcomes without sharing raw records | Neutral, but both sides have to take part |
| Modeling (MMM and lift tests) | Estimates each channel’s contribution and its causal effect | Good for budget decisions, but aggregate and slower |
How to read the table. No block is enough alone. Panels give accredited, familiar numbers but thin data for niche audiences. Big data adds scale, but it varies by device and provider. An identity graph or a clean room makes it possible to count a person once across platforms. Modeling then fills gaps and estimates cause and effect. Most tools combine two or three blocks, and the mix decides what the numbers can prove.
Three kinds of cross-media measurement tool. When people search for a cross-media measurement tool, they usually mean one of three things. Measurement providers, such as Nielsen, VideoAmp, iSpot and Comscore, produce the currency a buyer transacts on. Data collaboration platforms, such as LiveRamp’s clean room measurement, let two parties match audiences. Unification layers sit on the publisher’s side and reconcile the others into one view. A publisher usually needs the third kind, because it already works with the first two.

Why publishers cannot simply pick one currency
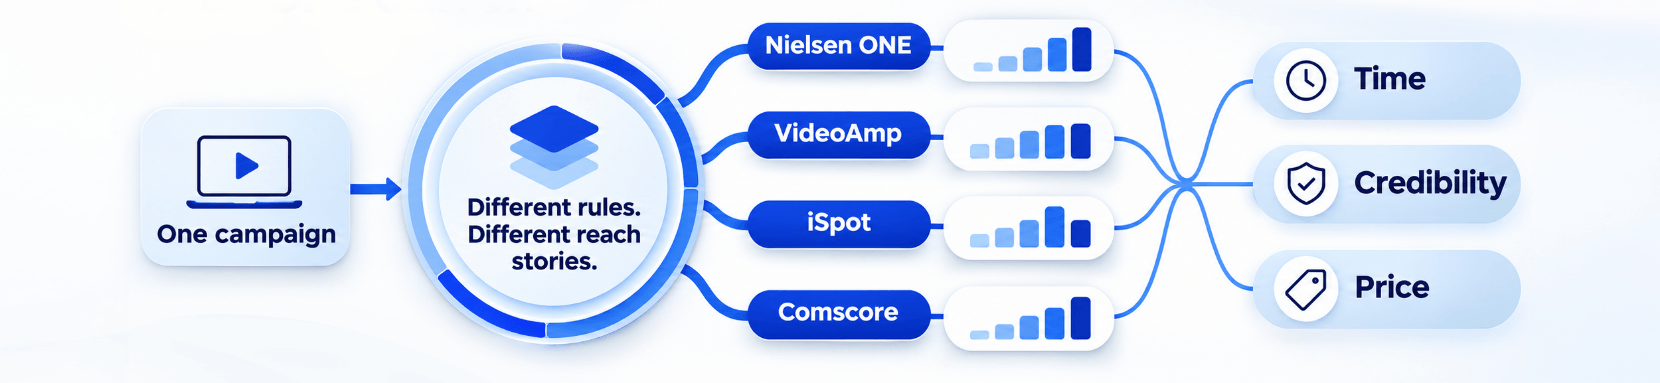
Most guides on cross-media measurement are written for advertisers: how to choose a tool and which methods to combine. A publisher’s problem is different. Buyers choose the currency, and they do not all choose the same one. MediaRadar’s pre-upfront analysis found that competing currencies, including Nielsen ONE, VideoAmp, iSpot and Comscore, are fragmenting the upfront marketplace (MediaRadar).
So one campaign can reach the negotiating table with three different reach numbers. Each is defensible on its own terms, and together they cost you time, because someone has to explain the gaps. Our post on the currency wars and upfront shows how that plays out.
The gaps usually come from method, not error. Panel makeup, how an impression is counted, the attribution window and the audience universe all differ by vendor, and measurement data still sits in silos that make comparison hard (AdExchanger).
What the gap costs. Three things suffer when the numbers disagree. Time: someone has to explain the gap before the real conversation can start. Credibility: a buyer who sees three numbers may trust none of them. Price: when the audience is in doubt, the talk drops back to cost per thousand. None of this is the buyer’s fault. It is what happens when three accurate counts are built on three sets of rules.
The One-Number Method: four steps to reconcile currencies
The One-Number Method is a four-step routine for turning several currencies into one agreed view. It works in order, because each step depends on the one before it.
| Step | What you do | Question it answers |
|---|---|---|
| 1. Align definitions | Agree what counts as an impression, a viewable ad, an audience and an attribution window | Are we counting the same thing? |
| 2. Normalize | Convert each vendor’s output to the agreed definitions and one unit, and write the rules down | Can the numbers be compared? |
| 3. Deduplicate | Remove people counted on more than one platform or vendor, using identity data or a clean room | How many different people is this? |
| 4. Validate | Check the result with a neutral party, such as an auditor or a clean room, and keep an audit trail | Will the buyer trust it? |
Step 1, align definitions. Start with the choices that move the number most: the viewability threshold, how long a view must last, which audience universe is the base, and the attribution window. Write them on one page and get the buyer’s agreement.
Step 2, normalize. Map each vendor’s output to those definitions and to one unit, such as people-based reach. Keep the mapping rules in a document, so you can show a buyer how a vendor’s 10.0M became 9.6M.
Step 3, deduplicate. A viewer who watches the live broadcast and the streaming replay is one person, not two. Use identity data or a clean room to find the overlap and count it once.
Step 4, validate. Ask a neutral party to check the work, whether an auditor or a clean room both sides trust, and keep an audit trail. Buyers believe numbers they can trace.
Do steps 1 and 2 before the upfront conversation, not during it. For steps 3 and 4, a data clean room lets a publisher and an advertiser match audiences without sharing raw records, as we explain in our guide to audience overlap analysis.
Worked example: three vendors, one campaign
Numbers make the method concrete. The example below uses illustrative figures, not client data, for one campaign that ran on linear TV and streaming. Three vendors report its reach. The infographic shows the same example visually.
- Before: Vendor A reports 10.0M, B reports 9.2M and C reports 11.1M. The average is 10.1M, so the spread is (11.1 − 9.2) ÷ 10.1 = 19%.
- After aligning definitions (the same viewability threshold and audience universe): A reports 9.6M, B 9.5M and C 9.7M. The spread is (9.7 − 9.5) ÷ 9.6 = 2%.
- After deduplicating across platforms: linear reach is 8.0M, streaming reach is 5.0M and the overlap is 1.4M. Adding the two gives 13.0M, but deduplicated reach is 8.0M + 5.0M − 1.4M = 11.6M. The simple total overstated reach by 1.4M, or 12%.
The buyer started with a 19% spread and a 12% overstatement. After the method, the spread is 2% and reach is one number.
How to run this on your own campaign. Pull the three vendors’ reports for the same flight and the same audience. List where their definitions differ. Calculate the spread, which is the highest number minus the lowest, divided by the average. Then agree definitions with the buyer and run it again. If a gap remains, one definition is still different, so find it. The two formulas to keep: spread = (highest − lowest) ÷ average, and deduplicated reach = reach on platform one + reach on platform two − overlap.
How to choose a cross-media measurement tool: six questions for a vendor
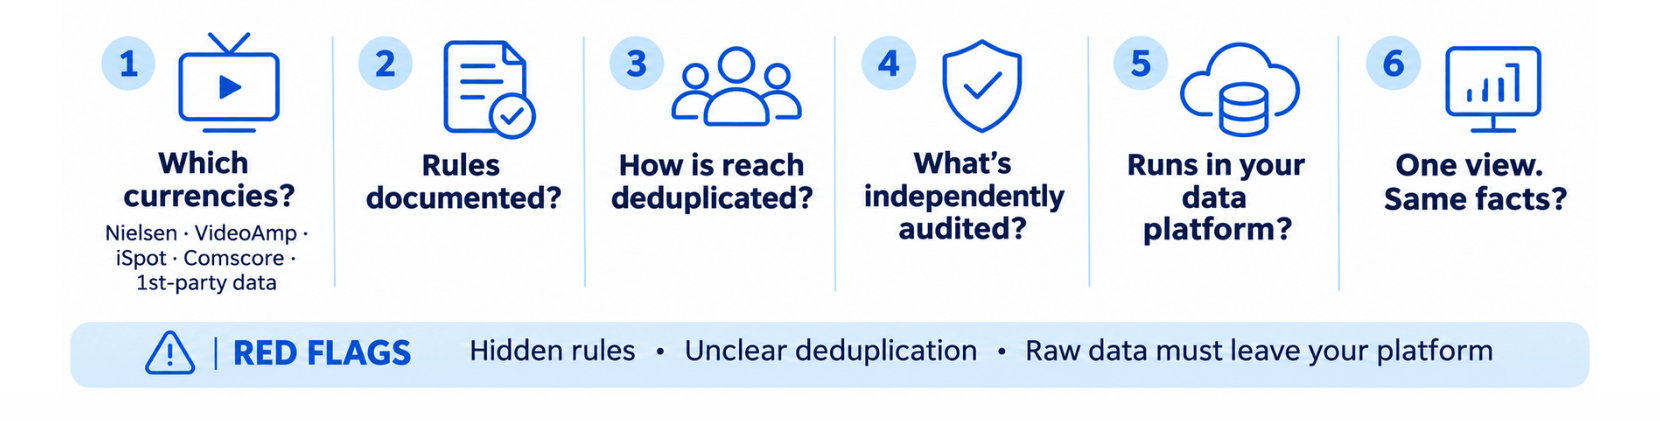
Whichever tool you consider, ask these six questions. The answers show whether it will help you reconcile numbers or just add a fourth version of them.
- Which currencies does it ingest? Nielsen, VideoAmp, iSpot, Comscore and your own first-party data.
- Are the normalization rules written down? If you cannot show them to a buyer, they will not trust the output.
- How does it deduplicate across linear and streaming? Ask what identity data it needs.
- What is independently audited or accredited? Ask which components, not the product as a whole.
- Does it run in your own data platform? That keeps raw data with you.
- Can it produce one view per agency or holding company from the same numbers? Buyers want their own cut, but not their own facts.
Red flags. A vendor that will not show its normalization rules, cannot say how it deduplicates, or needs you to move raw data out of your own environment makes a number harder to defend in front of a buyer.
A real example: a Big 3 TV network
A Big 3 US TV network moved from one measurement vendor to several, including VideoAmp and iSpot. Each vendor’s data sat in silos, and teams reconciled it by hand. After building a converged audience intelligence layer with Infocepts, manual reconciliation lead time fell by 70%, the executive and advertiser reporting cycle ran 30% faster, and daily insights arrived within 10 minutes. [Confirm these figures are cleared for external use]
What it shows. The gain did not come from adding another vendor. It came from reconciling once, in a standard way, and reusing the result for every team, so reporting no longer waited on manual work.
Where Infocepts fits
The Performance Insights Hub is Infocepts’ cross-platform measurement framework for publisher-scale ad sales teams. It ingests multiple currencies, maps methodology differences to one attribution model, and shows one performance view by agency, without replacing the measurement infrastructure you already have. See our approach to measurement and attribution for publishers, and how it connects to CTV, OTT and linear TV.
In the terms of this guide, multi-currency ingestion and the normalization layer cover steps 1 and 2, and clean room measurement covers steps 3 and 4. The result is the one-number view a sales team can defend.
How many versions of your campaign numbers do you have today? Book a measurement review and we will map your currencies to one view.
Frequently Asked Questions
How Many Versions of Your Campaign Numbers Do You Have?
Infocepts helps publishers reconcile Nielsen, VideoAmp, and iSpot into one defensible view that sales teams can take straight into the upfront.
The Infocepts Media & Entertainment COE helps streaming, publishing, and content businesses harness data to grow audiences and optimize revenue. The team specializes in content analytics, subscriber intelligence, ad tech data, and building the data foundations modern media companies need to compete.
Read Full BioRecent Blogs

10 best data modernization companies for media and entertainment
November 16, 2026

How to modernize manufacturing data with an Industry 4.0 data platform: Step-by-step guide (2026)
November 16, 2026

Managed Data and Analytics Services: What to Include, How to Measure and When It Makes Sense
November 14, 2026

The Enterprise AI & Data Transformation Partner. Delivering measurable business impact globally.
#1 on Gartner Peer Insights · 97.2% client retention