


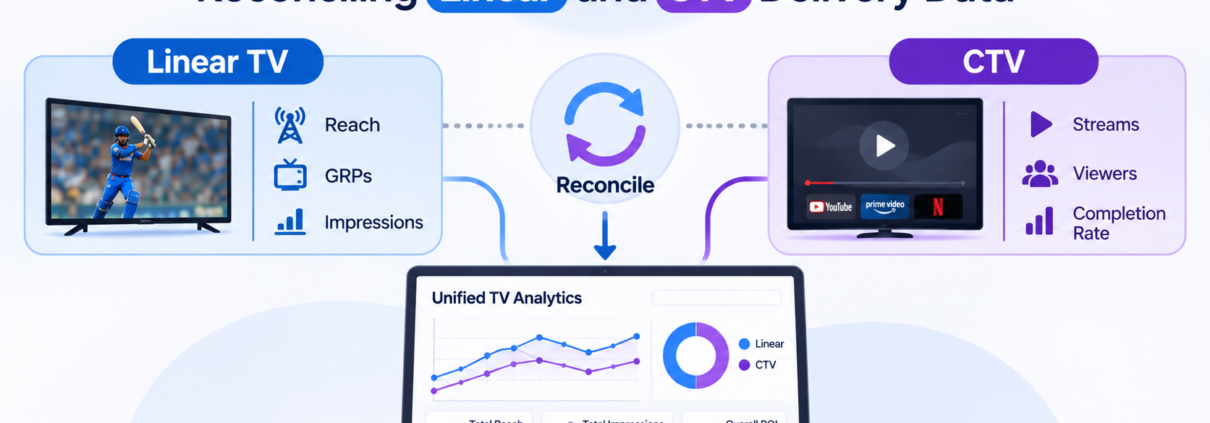
TV Advertising Analytics: Reconciling Linear and CTV Delivery Data
TV advertising analytics is the practice of measuring the delivery and results of ads across linear television and connected TV in one consistent view. The hard part is not collecting data. It is that the two worlds count differently, so numbers that look comparable are not.
If you have ever sat in a meeting where the linear report said one thing, the CTV report said another, and both were “correct,” this guide is for you. It sets out a metric dictionary, shows how to convert between units, and offers a reconciliation process you can apply to your own reporting.
Why the numbers do not line up
Linear television has long been measured with panels: a sample of households whose viewing is recorded and projected to the population. Results are expressed as ratings and gross rating points. Connected TV is measured with server-side logs: every ad served is counted by the ad server, and device data adds context.
That creates a basic mismatch.
- Linear numbers are estimates of people based on a sample.
- CTV numbers are counts of events from a log.
A single ad shown to a household can be “0.4 rating points” in one report and “1,200 impressions” in another. Neither is wrong. They are different quantities, and adding them together without conversion produces a number that means nothing.
The metric dictionary
| Metric | Linear definition | CTV definition | How to reconcile |
|---|---|---|---|
| Impression | Estimated viewers of the ad, from panel projection | An ad served and counted by the ad server | Label the source; do not sum without conversion |
| GRP | Reach percentage × average frequency | Not native; derived from impressions | Convert using the target universe |
| Reach | Unique viewers estimated | Unique devices or households | State the unit (person, household, device) |
| Frequency | Average exposures per viewer | Impressions ÷ unique reach | Compute on the same unit, after deduplication |
| Completion rate | Rarely reported | Completed views ÷ started views | Report for CTV; note that linear has no equivalent |
| Viewability | Not typically applicable | Based on a viewability standard | Report CTV only, with the standard named |
| CPM | Cost per thousand estimated viewers | Cost per thousand impressions | Compare on the same denominator |
| CPP | Cost per rating point | Derived | Use for cross-channel cost comparison |
Pin this table where planners and analysts can see it. Most disagreements trace back to two people using the same word for different things.
Converting CTV impressions to GRPs
A gross rating point is one percent of the target population reached, summed over exposures. The formula is:
GRP = (Impressions ÷ Target population) × 100
Worked example (illustrative)
A campaign delivers 3,000,000 CTV impressions against a target universe of 50,000,000 people.
GRP = (3,000,000 ÷ 50,000,000) × 100 = 6 GRPs
Check the result another way. If deduplicated reach is 1,500,000 people, then reach is 3 percent. Frequency is 3,000,000 ÷ 1,500,000 = 2.0. GRP is reach percentage times frequency: 3 × 2.0 = 6. The two routes agree, which is a useful sanity check.
Remember that the CTV impressions count events, not people. If many impressions come from the same household, the GRP is still correct as a sum of exposures, but reach will be lower than the impression count suggests.
Converting linear ratings to estimated impressions
Going the other direction, multiply the rating by the universe.
Estimated impressions = (Rating ÷ 100) × Universe
A 0.4 rating against a universe of 50,000,000 equals 200,000 estimated impressions per airing. Across 15 airings, that is 3,000,000 estimated impressions, or 6 GRPs. This shows the same campaign can be expressed in either unit once you agree the universe.
A four-step reconciliation process
- Pick a common unit. Household or person. Do not mix them in the same chart.
- Pick a common time window. Broadcast week or calendar week. Map one onto the other.
- Translate. Convert CTV impressions to GRPs, or ratings to estimated impressions, using a documented universe.
- Deduplicate where possible. Overlap between linear and CTV audiences exists. With an identity source or panel link, remove it. Without one, report the raw sum and the modeled estimate separately, and state which is which.
Document each decision once so the same answer appears in every report.
A reporting layout that works
Organize the dashboard so a reader moves from the whole to the parts.
- Top: total. Deduplicated reach and frequency across screens, with a note on the method.
- Middle: split by channel. Linear and CTV each in their native metrics.
- Lower: cost. Cost per point and cost per thousand side by side.
- Bottom: quality. Completion rate, viewability and invalid traffic for CTV.
Native metrics should always be visible alongside converted ones. Converted numbers are useful for comparison but should never replace the source data.
Linear and CTV delivery issues to watch
| Issue | Linear | CTV |
|---|---|---|
| Delivery discrepancy | Make-goods and rating shortfalls | Under-delivery, pacing errors |
| Quality | Clutter, adjacency, position in break | Viewability, fraud, device mix |
| Timing | Next-day or later currency data | Near real time logs |
| Targeting | Daypart and program based | Audience and data based |
CTV’s speed is a real advantage. Where linear needs weeks to reconcile with currency data, CTV logs allow mid-flight corrections. Use that speed to catch pacing problems early.
A mini case: one campaign, two reports (illustrative)
An advertiser buys a four-week flight targeting adults 25 to 54, a universe of 70,000,000 people. The linear report shows 18 GRPs. The CTV report shows 4,200,000 impressions. The brand manager asks a fair question: how much did we deliver in total?
- Convert CTV to GRPs. (4,200,000 ÷ 70,000,000) × 100 = 6 GRPs.
- Add the gross delivery. 18 + 6 = 24 GRPs. This counts every exposure, including repeats.
- Get reach from an identity or panel source. Suppose linear reached 10 percent of the universe, CTV reached 4 percent, and 1.5 percent saw both.
- Deduplicate. 10 + 4 − 1.5 = 12.5 percent reach.
- Compute frequency. 24 GRPs ÷ 12.5 reach points = 1.92 average exposures per person reached.
- Run a logic check. Reach in percentage points can never exceed GRPs, because everyone reached has at least one exposure. 12.5 is below 24, so the figures are consistent.
The final check catches many errors. If a report ever shows reach above GRPs, the two numbers use different audience definitions or time windows, and the combined figure should not be published until that is resolved.
The same campaign can therefore be summarized as: 24 gross GRPs, 12.5 percent deduplicated reach, and a frequency of about 1.9. That is a story a planner can act on, and a number a finance team can check.
Common errors
- Adding GRPs from different universes. A 6 GRP campaign against adults 18 to 49 is not the same as 6 against adults 25 to 54.
- Treating a CTV impression as a person. It is an ad event.
- Reporting completion rate for linear as if it were measured.
- Mixing broadcast and calendar weeks in the same trend line.
- Ignoring invalid traffic, which inflates CTV delivery. See ad fraud detection in CTV and OTT.
- Letting definitions drift. A “reach” figure that changes meaning between quarters ruins trend analysis.
Questions to ask your data
- What unit does this number describe, and what universe?
- Is this measured or modeled?
- Which period does it cover, and how is the week defined?
- Has it been deduplicated, and how?
- What would change my decision if this number were 20 percent different?
The last question matters most. If the answer is “nothing,” do not spend time reconciling that metric.
Where Infocepts fits
AdScape 360 unifies delivery logs and currency data under a shared dictionary, so planners see one consistent story across screens and analysts do not rebuild the same conversion in every spreadsheet. To go beyond delivery to outcomes, read our guides on cross-media measurement, CTV advertising examples and media mix modeling vs multi-touch attribution.
FAQ
What is TV advertising analytics?
It is the measurement of ad delivery, audience and outcomes across television channels and formats, including linear and connected TV.
What is a GRP?
A gross rating point is reach percentage multiplied by average frequency. One GRP equals one percent of the target population reached once.
How do you compare CTV and linear performance?
Convert both to a common unit, such as GRPs or households, define the universe and time window, and note which figures are measured versus modeled.
Can you deduplicate audiences across linear and CTV?
Only with a shared identity source, panel or statistical model. Otherwise report the channels separately and label any combined estimate.
Why is CTV reported in impressions and linear in ratings?
Because CTV counts ad events from server logs, while linear estimates audiences from panel samples.
How often should TV advertising reports be refreshed?
CTV can be reviewed daily or weekly during a flight. Linear typically follows the cadence of currency data releases.
Recent Blogs



The Enterprise AI & Data Transformation Partner. Delivering measurable business impact globally.
#1 on Gartner Peer Insights · 97.2% client retention