

How Much Does TV Advertising Cost in 2026? Linear, Streaming and Live Sports Prices Explained

 Published:
 12 min read
 Share



Last updated: 23 November 2026 | Prices checked: 23 November 2026 | Next scheduled update: 12–16 January 2027
In short: streaming TV usually costs about $15 to $65 per thousand impressions, depending on inventory, with live sports at the top. National linear is quoted in a similar band, and local spots start far lower. A 30-second Super Bowl spot averaged about $8 million in 2026. Price depends on audience, scarcity and how you buy.
In this guide
- TV advertising cost at a glance (2026)
- How TV advertising is priced: CPM, spots and cost per point
- What drives TV advertising prices up or down
- Live sports and the Super Bowl: why prices spike
- How publishers set TV ad prices: the seller’s side
- How to estimate your TV advertising budget
- Five ways to get more from your TV advertising budget
- Use and share this price ladder
- Where Infocepts fits
- How we keep these prices current
- Frequently asked questions
TV advertising cost at a glance (2026)
TV advertising is priced in two main ways. Streaming and most digital buys are sold by CPM, the cost per thousand ad impressions. Linear TV is sold by the spot or by cost per rating point, and many guides translate that into a CPM so the two can be compared. The figures below are 2026 benchmarks. They are ranges to plan with, not quotes.
| Format | Typical CPM | Entry point | Watch out for |
|---|---|---|---|
| Local linear broadcast | $5–$15 | Varies by market | Market size and daypart move the price |
| Local cable | $10–$20 | $500–$2,000+ a month | Lower reach, market-dependent |
| National linear broadcast | $25–$40 | $25,000+ per flight | Upfront and scatter prices differ, and some guides quote higher |
| FAST channels | $15–$25 | Low minimums | Cheapest tier, so check content quality |
| Streaming, open exchange | $15–$30 | From about $50 a day on self-serve platforms | Supply-chain transparency and fraud risk |
| Streaming, direct premium | $25–$65 | Managed service often $1,000–$5,000+ a month | Fees stack on top of the quoted CPM |
| Live sports on streaming | $40–$80+ | Depends on the event | Scarce inventory, and demand spikes |
| Super Bowl, 30 seconds | Priced per spot | About $8 million on average in 2026 | Premium spots reached $10 million or more |
These ranges come from two 2026 guides built on eMarketer data, one from the streaming platform Vibe and one from AdWave. AdWave puts the blended average CTV CPM at about $26, with most campaigns landing between $25 and $35. Because both publishers sell advertising, treat their numbers as directional.
Why guides disagree. Another 2026 agency guide cites about $47 for a broadcast CPM and about $23 for cable (DesignRush), well above the national linear range above. The gap comes from the mix of inventory each guide measures, whether the buy is upfront or scatter, the market and daypart, the season, and whether fees are included. Season alone can move a price: AdWave reports battleground-state CTV CPMs of about $43 in October 2026, because of political demand (AdWave).
How TV advertising is priced: CPM, spots and cost per point
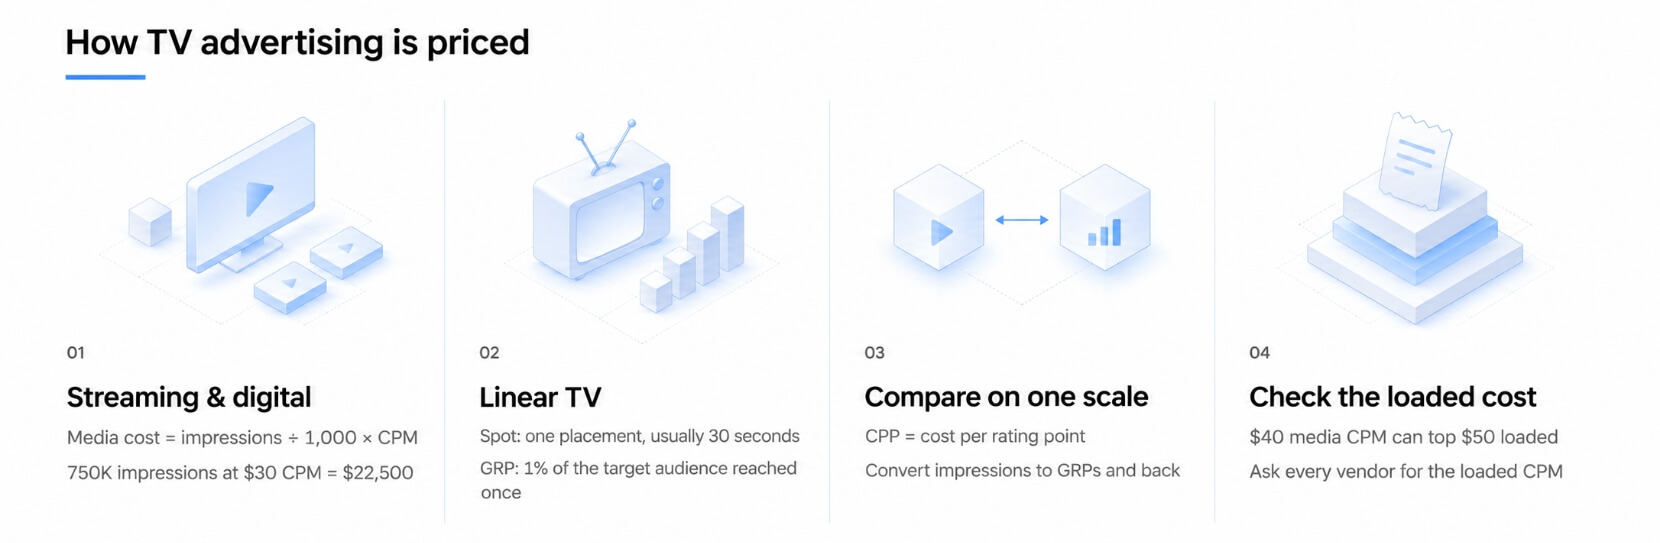
For streaming and digital TV, the arithmetic is simple. Media cost equals impressions divided by 1,000, multiplied by the CPM. A campaign that needs 750,000 impressions at a $30 CPM costs $22,500 in media.
Linear TV adds two older terms. A spot is a single placement, usually 30 seconds. A gross rating point (GRP) is one percent of the target audience reached once, and cost per point (CPP) is what one GRP costs. To compare linear and streaming on one scale, convert between them. Our guide to TV advertising analytics shows how to turn impressions into GRPs and back.
The quoted CPM is rarely the real cost. It usually covers the media only. On programmatic buys, platform and data fees stack on top. Vibe’s guide estimates DSP fees at 10% to 20% of media spend and the all-in buy-side markup at roughly 18% to 30%, so a $40 media CPM can land above $50 once loaded (Vibe). Ask every vendor for the loaded CPM before you compare prices.
What drives TV advertising prices up or down
Six things move the price more than anything else. Knowing them lets you read any rate card.
- Audience precision. A broad demographic buy runs about $15 to $25 CPM. Behavioral and intent audiences run $25 to $40, and first-party or retargeting audiences $35 to $65 (Vibe). Tighter targeting costs more per thousand but wastes fewer impressions.
- Inventory tier. AdWave’s rule of thumb is that under about $20 usually means FAST, and over about $40 usually means premium or live sports (AdWave).
- Timing and season. Prices rise in the fourth quarter, around live events and in election years, when demand concentrates.
- How you buy. Upfront deals, scatter buys, direct deals and open auctions all price the same inventory differently. A guarantee costs more than an auction because the seller takes on delivery risk.
- Supply. More streaming inventory is flattening prices. eMarketer notes that streaming CPMs are flattening as CTV inventory swells (eMarketer), and DataBeat recorded a 12.3% annual decline in connected TV pricing in June 2026 (PPC Land).
- Market and daypart. For local linear, the size of the market and the time of day matter as much as the channel.
These are also the levers a publisher controls when it sets a price, which is the subject of a later section.
Live sports and the Super Bowl: why prices spike
The Super Bowl is the clearest example of scarcity pricing. For Super Bowl LX in February 2026, NBCUniversal sold 30-second spots at an average of about $8 million, with some at $10 million (eMarketer). Statista’s chart shows the average 30-second price rising from $4.3 million in 2015 to $8.0 million by 2025 and 2026 (Statista).
For Super Bowl LXI on February 14, 2027, Disney told advertisers it believes a 30-second spot should cost $10 million, though some marketers pushed back (Awful Announcing, citing Variety). The asking price is where the negotiation starts, not where it ends.
Three forces explain the price. The audience is enormous and cannot be rebuilt on another night. Demand concentrates in a handful of windows. And the spot often comes with conditions: a media buyer quoted in one report said a $7 million ad could also require an additional $7 million buy across other properties such as the Olympics (AOL). The same logic works at smaller scale across live sports on streaming, which is why those CPMs run $40 to $80 or more.
How publishers set TV ad prices: the seller’s side
Most cost guides are written for advertisers, so they stop at the price tag. A publisher builds that price from four things: what the audience is worth, how many windows are available, what buyers will pay at that moment, and the cost of the risk it takes on by guaranteeing delivery.
Publishers rarely sell at one price. They tier inventory into guaranteed deals, preferred or private marketplace deals, and open auction, and they set a floor for each tier. A guarantee is worth signing only if its CPM beats what the auction would pay for the same window, plus the cost of a possible make-good. Our guide to programmatic guaranteed pricing shows how to calculate that.
That is why the same 30 seconds can cost $20 per thousand in one place and $60 in another. You are not paying for the ad. You are paying for the audience, the scarcity and the certainty of delivery. Publishers protect that certainty by tracking delivery as it happens, which is what AdScape 360 and the Inventory Optimization Multiplier are built for.
A quick check on your own pricing. If you sell TV or streaming inventory, ask yourself five questions.
- Do you price every window on its own, or on a season average?
- Do you know what the auction would pay for each window you guarantee?
- Do you know what a make-good costs you per thousand impressions?
- Do you track pacing during the event, not after it?
- Do you report one reach number that buyers accept?
If you answered no to two or more, you are probably leaving yield on the table. The tiering and break-even steps above are the place to start.
How to estimate your TV advertising budget
Start with the households you want to reach and how often. Households multiplied by frequency gives impressions. Impressions divided by 1,000 and multiplied by the CPM gives media cost. Then add fees. Two worked examples follow, using illustrative numbers.
- Example A, planning forward. Reach 150,000 households five times each: 150,000 × 5 = 750,000 impressions. At a $30 CPM, media cost is 750 × $30 = $22,500. Adding about 15% for fees gives $25,875. That works out to about $0.15 per household for five exposures.
- Example B, working backward. A $10,000 budget at a $28 CPM buys $10,000 ÷ $28 × 1,000 = about 357,000 impressions. At a frequency of four, that reaches about 89,000 households.
These numbers show delivery, not results. They tell you how many impressions you are buying, not how many customers you will win. To find that out, run a small test, compare an exposed group with an unexposed one, and measure the cost per incremental result. Our guide to TV advertising analytics covers how to read the delivery data.
Five ways to get more from your TV advertising budget
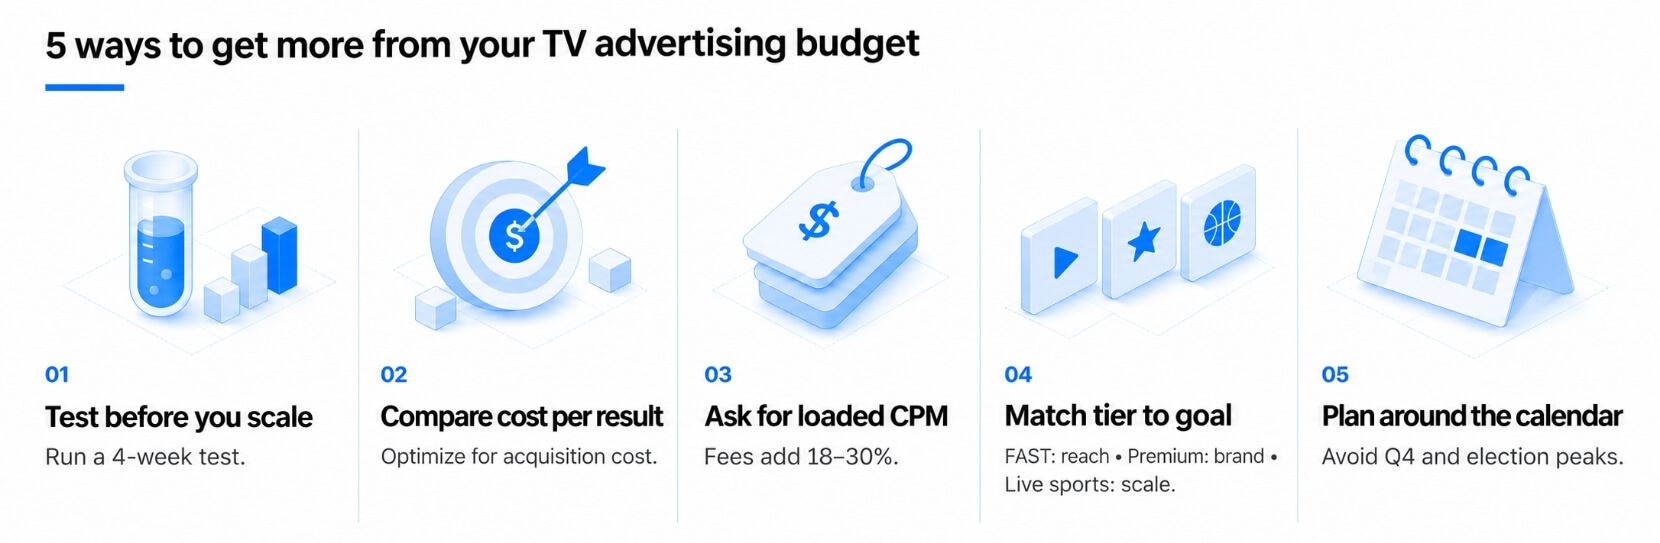
The cheapest CPM is rarely the cheapest result. These five habits lower the real cost per customer.
- Test before you scale. A small four-week test shows what a thousand impressions actually produce.
- Compare cost per result, not CPM. A higher CPM with a better audience often wins on cost per acquisition.
- Ask for the loaded CPM. Fees can add 18% to 30% to the headline rate.
- Match the tier to the goal. FAST suits low-cost reach, premium suits brand and attention, and live sports suits moments that need scale.
- Plan around the calendar. Avoid the fourth quarter and election peaks if the timing is flexible.
For how linear, CTV and OTT compare beyond price, see our guide to CTV, OTT and linear TV advertising.
Use and share this price ladder
You are welcome to use Figure 1 in your own articles, decks and newsletters, with credit to Infocepts and a link to this page. We also made a one-page cheat sheet, sized for LinkedIn and presentations, with the ranges and both formulas.
To embed the chart on your site, copy the code below. It includes the credit line and the link back to this guide.
<figure>
  <a href="https://www.infocepts.ai/blog/tv-advertising-cost/">
    <img src="[image URL after upload]" alt="2026 TV advertising price ladder: typical CPM ranges by format" width="1100" />
  </a>
  <figcaption>Source: <a href="https://www.infocepts.ai/blog/tv-advertising-cost/">Infocepts, TV advertising cost in 2026</a></figcaption>
</figure>
Where Infocepts fits
If you sell TV and streaming ads, the price on the rate card is only half the story. Whether you earn it depends on delivery. AdScape 360 gives unified visibility into yield across linear and digital deals, and the Inventory Optimization Multiplier adjusts pacing in real time to protect committed campaigns while keeping premium inventory for the highest-yield demand.
If you are an advertiser, our guide to TV advertising analytics shows how to read what you bought. If you sell TV or streaming inventory, book a pricing review and we will help you tier, price and protect your windows.
How we keep these prices current
TV prices move with demand, season and live events, so we review this guide on a fixed schedule. We check the CPM ranges against the sources above, update the Super Bowl figures when final prices are reported, and record each change in the log below.
Spot a number that looks out of date? Tell us and we will check it.
| Date | Update |
|---|---|
| 23 November 2026 | Guide published with 2026 CPM benchmarks and the Super Bowl LX average. |
| 12–16 January 2027 | Planned: refresh CPM ranges, update the title for 2027 and add Super Bowl LXI pricing. |
| February 2027 | Planned: update with final Super Bowl LXI prices after the game. |
| May 2027 | Planned: update after the 2027 upfronts. |
Frequently Asked Questions
Price and Protect Your TV and Streaming Inventory
Infocepts helps publishers tier, price, and protect their TV and streaming windows with unified yield visibility and real-time pacing.
Related Tags
Share This Article
The Infocepts Media & Entertainment COE helps streaming, publishing, and content businesses harness data to grow audiences and optimize revenue. The team specializes in content analytics, subscriber intelligence, ad tech data, and building the data foundations modern media...
Recent Publications
cross-channel measurement
