



Linear TV advertising is the sale of commercial slots in scheduled broadcast and cable programming. Publishers now sell it next to streaming and FAST inventory. When each is sold in its own stack, one advertiser can pay several times to reach the same viewer. One cross-platform buy removes that duplication.
The question no seller can answer before the flight
Picture an agency planner at upfront time. She opens three proposals from the same media company: linear, streaming and FAST. Each shows strong reach. She adds them up and gets a total she does not believe, because some viewers sit in all three. So she asks: how many different people is this?
On the seller’s side, nobody can answer before the flight starts. Each platform team knows its own reach. No one owns the combined, deduplicated number. The answer arrives weeks later in a report, next to a credit request. This is an illustrative scene, not a client story. This post shows what that costs and how to answer the question before the proposal goes out.

What is linear TV advertising, and how is the market changing?
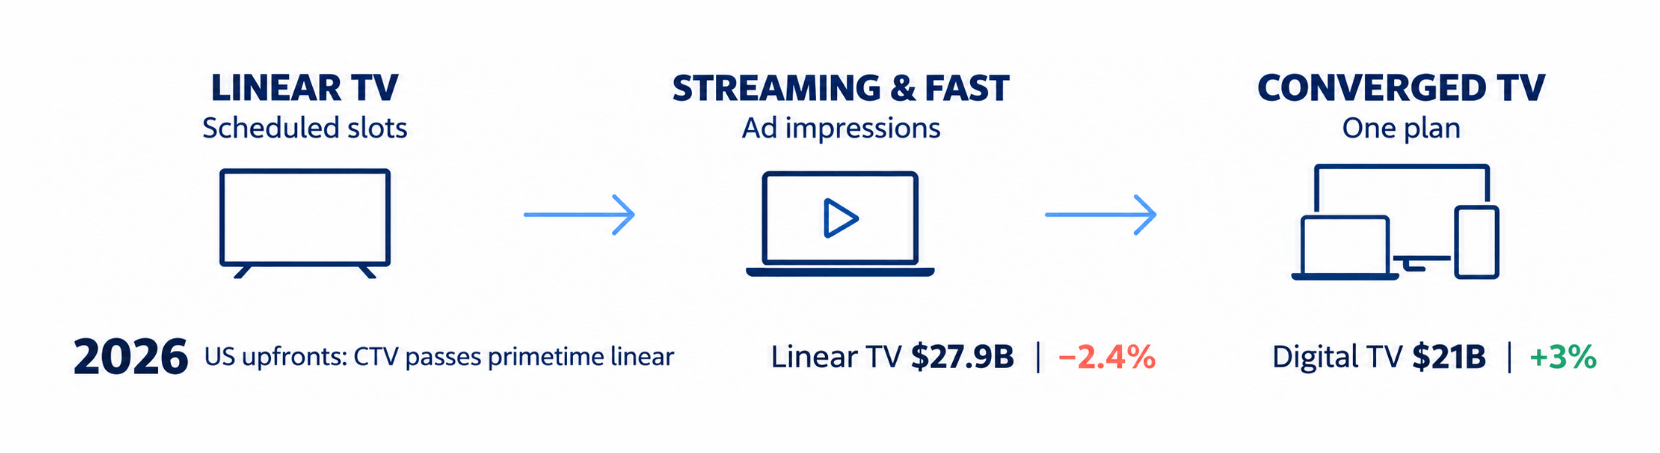
Linear TV advertising, also called linear advertising, is the sale of commercial time in programming that airs on a fixed schedule over broadcast, cable and satellite. The advertiser buys a slot in a daypart, on a network, around a program. Upfront deals are struck early for better rates. Scatter deals are bought closer to air. Sellers price slots on ratings, guarantee an audience, and run makegoods, extra spots also called audience deficiency units, when delivery falls short. Programmatic linear TV now brings automated, audience-based buying to this inventory.
Streaming and FAST work differently. FAST earns its money entirely from ads (eMarketer). Inventory is counted in impressions, sold direct or programmatically, and run on different ad servers. Separate stacks mean separate teams, proposals and reports. For more, see OTT advertising, CTV, OTT and linear TV differences and why streaming broke the old ad ops playbook.
The market is shifting toward one plan. eMarketer’s April 2026 forecast chart projects CTV passing primetime linear in US upfront ad spending in 2026 (source). Madison and Wall expects national and local TV network ad spend, excluding political, to fall 2.4% in 2026 to $27.9 billion, while digital TV grows 3% to $21 billion (source). Linear is still the larger budget, but buyers now plan converged TV, linear and connected TV together, and expect one answer across screens. Live events make this plain, as we covered in tentpole-event revenue risk.
TV advertising cost: where a split buy leaks revenue
TV advertising cost moves with daypart, program demand, audience, spot length and season on linear, and with targeting and deal type on streaming. A planner blends these prices and the total looks fair. But CPM counts impressions, not different people, so a split buy hides three leaks.
The overlap leak – A household watches a show live, then streams the replay. The same programming runs on a FAST channel. Each platform reports the people it reached, and none knows who the others reached. Duplicated reach is the gap between reach added up and the number of different people actually reached.
The pricing and guarantee leaks – Each stack has its own rate card and discount rules, so the planner negotiates the lowest of each and three internal teams bid against each other for one budget. A deal desk with cross-platform precedent fixes much of this, as we describe in rate-card negotiation. Guarantees are also written per platform. If streaming under-delivers in week two, linear cannot make it good, so a manual makegood is negotiated late. Small gaps add up, as our post on the $40 million revenue leak shows.
Advertisers do not ask which screen is best. They ask how many different people they are paying to reach.
If part of the audience sits on both platforms, the advertiser paid twice and CPM cannot show it. Cost per 1,000 unique people can. Late makegoods add a second cost: they use slots the seller could have sold.
Linear TV vs CTV advertising: what sellers actually need
Most guides on linear TV vs CTV advertising, or addressable TV vs linear TV, are written for the buyer and ask which screen to pick. A publisher needs to know how to sell them together. The usual workaround, a spreadsheet that merges reports after the fact, arrives after the decision and cannot remove duplicated people. Incentives add to it: where teams are measured by platform revenue, each protects its own number.
Selling one buy takes three layers. The inventory layer gives one live view of sold and open supply across linear, streaming and FAST, forecast by audience. The audience layer computes deduplicated reach from a shared, privacy-safe view, inside a governed space such as a data clean room, so neither side exposes raw records. The guarantee layer applies one pricing logic, one currency and real-time pacing, so the seller catches drift and moves inventory inside guardrails (ad operations and campaign intelligence). AI forecasts supply, proposes the package mix and flags delivery risk early. That is revenue intelligence for media ad sales.
Measure it: the One-Buy Readiness Score and the metrics behind it
Not every publisher should converge tomorrow. Score each test 0, 1 or 2, then add them up.
| Test | 0 | 1 | 2 |
| Inventory view. Can sales see sold and open supply for all three platforms? | Separate systems | Manual, shared sheet | One live view |
| Overlap. Do you check duplicated reach before you propose? | Never | After the flight | Pre-sale, per advertiser |
| Currency. Can you guarantee delivery to one measurement currency? | No | On some platforms | Yes, across all |
| Pricing. Is there one rate-card and discount logic? | Separate | Partial | One |
| Protection. Can you make good a shortfall across platforms? | No | Manually | Automated, with guardrails |
0 to 3: sell separately. Fix your data first. 4 to 7: package. Disclose the overlap and guarantee each platform on its own. 8 to 10: converge. Sell one proposal, one guarantee and one report. Run the score with sales, ad ops and revenue ops together. Where their scores differ, you have found your gap.
Every number in this post uses the definitions below. R_L is linear reach, R_S is streaming reach and R_U is unique combined reach: different people exposed on at least one platform.
| Metric | Formula | What it tells you |
| CPM | Cost ÷ impressions × 1,000 | Price of 1,000 impressions |
| Duplicated reach | R_L + R_S − R_U | People you charged twice |
| Duplication rate | Duplicated reach ÷ (R_L + R_S) | Share of paid reach that repeats |
| Incremental reach | R_U − R_L | New people streaming adds to linear |
| Cost per 1,000 unique reached | Spend ÷ R_U × 1,000 | The true price of an audience |
Which currency a guarantee uses is still contested. See the measurement currency debate and our glossary on media measurement and attribution.
Worked example: the true cost of a split buy
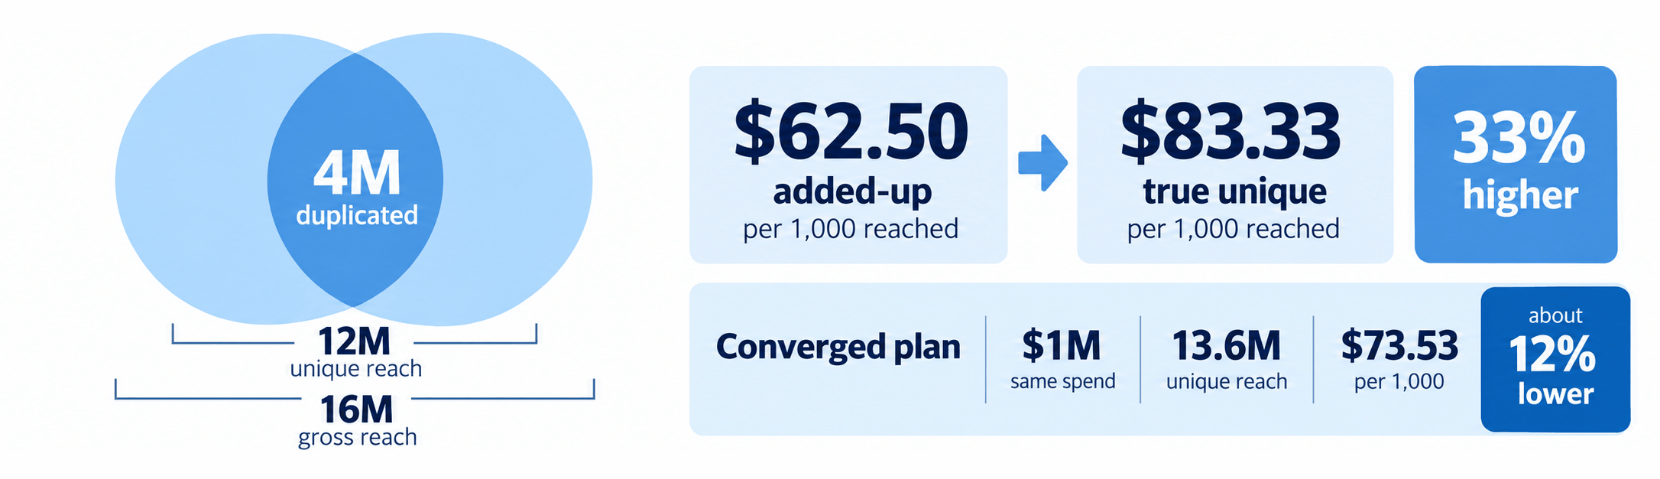
Illustrative numbers, not client data. An advertiser spends $600,000 on linear for 30M impressions (a $20 CPM), reaching 10M people. It spends $400,000 on streaming for 20M impressions (also $20), reaching 6M. Combined unique reach is 12M.
Duplicated reach: 10M + 6M − 12M = 4M people. Duplication rate: 4M ÷ 16M = 25%.
Incremental reach: streaming adds 2M people, 20% on top of linear.
Cost per 1,000 reached: $62.50 added up ($1,000,000 ÷ 16M), but $83.33 unique ($1,000,000 ÷ 12M).
The true cost is 33% higher than the added-up view. The advertiser paid for 4M people twice.
A converged plan that cuts duplication to 15% at the same spend lifts unique reach to 13.6M and lowers cost per 1,000 unique reached to $73.53, about 12% less. A seller who brings the overlap number and a plan that lowers it moves the negotiation from price to value.
How to start: a 90-day path with Infocepts
- Weeks 1 to 2: score yourself – Run the score with sales, ad ops and revenue ops, and name an owner for each gap.
- Weeks 3 to 6: measure overlap – Report duplicated reach on the last campaigns of your ten largest advertisers, by hand if your systems do not connect.
- Weeks 7 to 12: pilot one converged package – One proposal owner, one guarantee, one report. Compare cost per 1,000 unique reached before and after.
The work starts with the data, not the dashboard. AdScape 360 gives sellers one revenue view across linear and digital. Inventory Optimisation Multiplier reallocates inventory across direct and programmatic inside delivery guardrails, so yield rises without breaking guarantees.
Frequently Asked Questions
Where does your stack score?
Book a revenue-intelligence consult and we will run the One-Buy Readiness Score with your team.
The Infocepts Media & Entertainment COE helps streaming, publishing, and content businesses harness data to grow audiences and optimize revenue. The team specializes in content analytics, subscriber intelligence, ad tech data, and building the data foundations modern media companies need to compete.
Read Full BioRecent Blogs




The Enterprise AI & Data Transformation Partner. Delivering measurable business impact globally.
#1 on Gartner Peer Insights · 97.2% client retention