


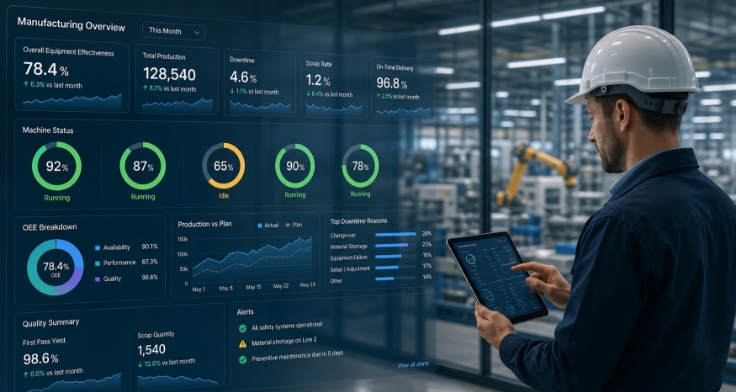
Your team already has reports, dashboards, and spreadsheets. What you don’t have is manufacturing analytics that tells you what to fix on the line this week, which supplier is about to hurt your OTIF score, or which asset will bring your factory to a halt next month.
That’s where focused manufacturing analytics and manufacturing AI step in: not as another “data initiative,” but as a way to make better calls on supply chain, quality, and day-to-day factory operations with the data you’re already collecting. It is the discipline behind every solution in the Infocepts manufacturing portfolio, and the sequence below is the one that gets there fastest.
Why Manufacturing Analytics Fails And How To Fix It
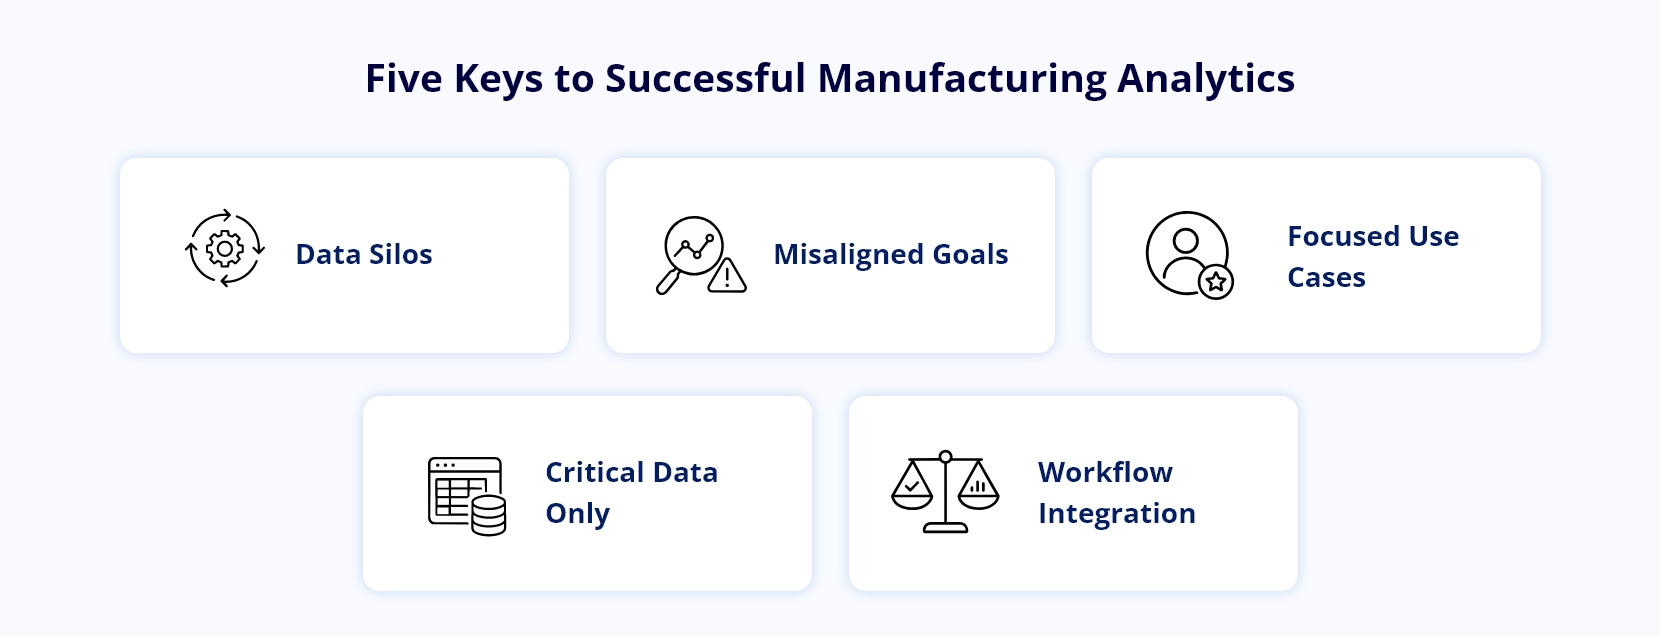
Most manufacturers didn’t start with a blank sheet and a vision of smart manufacturing; they layered new systems on top of old ones for 10–20 years. The result is data silos, partial integrations, and analytics projects that stall after a few glossy dashboards.
The root problem is usually misalignment. Plant managers need clearer priorities for the next 12 weeks. Supply chain leaders want fewer disruptions. Finance wants inventory under control. A generic industrial analytics project that tries to serve everyone with the same model pleases no one.
Fixing this starts with three moves: narrow the use cases, connect only the data that matters, and put the insights where work actually happens. That might mean quality alerts inside an MES screen, exception-based supply chain analytics in your planning tool, or a weekly maintenance risk list pushed to email or mobile.
Building The Data Foundation On Your Terms
Before you think about advanced manufacturing data analytics, make peace with the fact that your data will never be perfect. You don’t need perfection to get value; you need to know which gaps matter for each decision.
Start by listing your high-value questions: Which work centers cause the most unplanned downtime? Where do you consistently miss promise dates? Which products have the highest scrap and rework rates? Map those questions to specific data sources such as MES, historians, ERP, WMS, and quality systems.
Then decide how “fresh” the data needs to be. For shop-floor operational intelligence, you might need sub-minute updates from the line. For network-wide capacity planning, hourly or even daily granularity is fine. The mistake most teams make is forcing everything into real time, which drives cost without improving decisions.
Match Data Freshness To The Decision, Not The Technology
| Decision | Who makes it | Freshness actually needed | Primary sources |
|---|---|---|---|
| Stop or adjust a running line | Operator, line supervisor | Sub-minute | Historian, MES, PLC tags |
| Reschedule a maintenance job | Maintenance planner | Daily | Sensor history, CMMS, work orders |
| Change the production mix | Planner, scheduler | Daily to weekly | ERP orders, forecast, line capacity |
| Isolate a quality driver | Quality engineer | Per batch or lot | Quality system, supplier lots, changeover logs |
| Re-source or re-buffer across sites | Network supply chain lead | Weekly to monthly | Multi-site ERP, supplier performance, logistics |
Reading the table the other way is the useful part: only the top row justifies streaming infrastructure. Everything below it is a batch problem wearing a real-time costume, and building it as real-time analytics adds cost without changing a single decision.
Connecting OT, IT, And Business Context
On paper, connecting OT data and IT data sounds straightforward. In practice, joining sensor tags to work orders, SKUs, and shifts is the step that quietly kills most factory analytics projects.
Focus first on creating durable keys: asset IDs that remain stable over time, product IDs that clearly map to routes and BOMs, and operator or shift codes you can actually track. Then standardize how those show up across systems, even if the underlying tech stays messy for a while.
Once that spine exists, you can start building subject-specific models for topics like scrap analysis, changeover performance, or capacity versus demand, feeding each one only the data it truly needs.
Applying Manufacturing AI Where It Pays Off
Manufacturing AI works best when it narrows the world, not when it tries to “optimize the factory” in one leap. Think of it as a set of small, specialized copilots: one that flags a likely quality drift, another that predicts a late supplier, another that suggests a better production sequence for a given shift.
That is deliberately how the Infocepts manufacturing agents are scoped — OEE visibility and alerting, quality vision, yield optimization, and energy optimization are separate agents against separate decisions, rather than one model asked to do everything.
Start with problems you can describe in clear business terms. For example: “We want to cut minor stoppages on Line 3 by 20% in six months,” or “We want earlier warning when a critical supplier will miss deliveries by more than two days.” Then pick AI techniques that fit the question instead of forcing everything into one single model.
Predictive Maintenance That Maintenance Actually Uses
A lot of predictive maintenance efforts drown in false positives or black-box scores that technicians don’t trust. The goal is not a perfect model; it’s a maintenance planner who feels confident rescheduling one job because your signal is better than their gut.
That usually means combining sensor data with simple operational features: starts and stops, load levels, ambient conditions, and known maintenance events. Start with a handful of high-impact assets, like bottling lines or furnaces, and measure success in avoided downtime hours, not model accuracy. That narrow framing is what a predictive maintenance intelligence agent is built around, and it is the pattern behind both the clean-in-place systems and pharma manufacturing deployments.
Over time, you can expand your industrial analytics for maintenance to include spare parts risk, vendor reliability, and technician productivity, but only after the basics are working in one or two plants.
From Dashboards To Day-To-Day Operational Intelligence
Most plants already have dashboards for OEE, throughput, and scrap. The problem is that these dashboards describe what happened, not what to change. Operational intelligence is about turning that lagging view into timely prompts that line leaders can actually act on.
A practical pattern is “exception-first” views. Instead of 20 charts on a wall, give supervisors a daily or shift-level list of lines or work orders that deviate from plan by more than a threshold. Click in, and they see contributing factors like changeover overruns, start-up scrap, or micro-stops.
Smart Manufacturing Use Cases That Stick
Pick a handful of smart manufacturing scenarios with a clear owner and measurable outcome. Examples include reducing changeover time variance, stabilizing first-pass yield on a critical product family, or cutting blocked and starved time between two linked machines.
Each use case should have four ingredients: a defined metric, a baseline, an agreed target, and a weekly review cadence. If one of those is missing, the analytics will slide into “interesting, but not urgent” and your team will drift back to spreadsheets.
Keep the visuals simple. Supervisors don’t need ten dials; they need one clear signal that tells them where to look first and what changed versus last week.
Supply Chain And Quality: Where Analytics Pays Back Fast
While plants wrestle with daily firefighting, small changes in supply chain analytics can return real cash in a quarter or two. The sweet spot is usually demand and supply alignment for a subset of high-margin or high-volume SKUs.
Start by combining historical shipments, forecast data, and confirmed customer orders into one view, then attach constraints: real line capacity, planned maintenance, and key material availability. This lets planners see which SKUs are truly at risk and adjust production mixes before customers feel the impact. A supply chain resilience agent operates on exactly that combination, and the business case for an AI-ready supply chain data platform sets out what the returns look like when it is built properly.
On the quality side, don’t jump straight to vision AI on every station. Begin with simple defect pattern analysis at the batch or lot level. Tie defects back to machine, shift, supplier lot, and changeover. Very often, this is enough to isolate two or three controllable drivers without a single new sensor.
Factory Analytics That Connect Plant And Network Decisions
The next step is connecting factory analytics to network decisions like sourcing, buffering, and regional allocation. That’s where plants in the USA and Europe often struggle, because each site solved problems in its own way for years.
Build a minimal set of shared definitions first: what counts as on-time, how you measure capacity, and how you classify root causes. Then you can compare sites honestly, spot structural constraints, and decide where AI or automation will pay off fastest.
This is also where scenario modeling starts to matter: showing, for example, what a two-day slip on a critical component does to service levels and which mitigations cost least. A digital twin of operations is the usual vehicle for that question, because it lets you test the mitigation before committing the inventory.
Making Manufacturing Analytics Stick Across Sites
Rolling out manufacturing analytics across multiple plants is less a technology challenge and more an adoption challenge. Each site has its own habits, local workarounds, and views on “how we really run this line.”
Success usually comes from treating analytics as a product, not a project. That means versioning changes, collecting feedback, and being explicit about what you will improve next based on how supervisors and planners actually use the tools.
Practical Governance For Manufacturing AI Solutions
Good governance for manufacturing AI solutions doesn’t require a large committee, but it does need clear rules. Decide who can change metrics, who approves new models going into production, and how you’ll retire reports or dashboards that no longer help. Where safety or regulatory reporting is in scope, a safety and compliance agent makes those rules enforceable rather than aspirational.
Keep a short, public backlog of requested changes and new use cases. This does two things: it reduces one-off “can you build me a report” requests, and it shows the business that analytics is evolving based on their real frustrations.
Finally, measure adoption as carefully as you measure accuracy. If a model’s predictions look great on paper but planners ignore them, that’s a design or trust problem, not a success story.
Where Infocepts Fits
Infocepts delivers manufacturing analytics as governed, platform-native solutions rather than standalone dashboards, with named agents scoped to individual plant decisions instead of one model asked to optimize the factory.
- Rated #1 Data & Analytics provider on Gartner Peer Insights, three years running, with 97.2% client retention across 20+ years of delivery.
- Eight named manufacturing agents, each against one decision: OEE visibility and alerting, predictive maintenance intelligence, quality vision, yield optimization, energy optimization, safety and compliance, digital twin operations, and supply chain resilience.
- Platform-native delivery across Databricks, Snowflake, and Microsoft, so the OT–IT spine described above is built once and reused by every use case that follows.
- Proven on plant-floor problems, including AI-driven predictive maintenance in pharma manufacturing and clean-in-place systems.
The Bottom Line
Done well, manufacturing analytics turns data from a reporting burden into a practical tool for better decisions on the line, in the warehouse, and across your network. It won’t fix everything overnight, but focused use cases, honest data foundations, and tight feedback loops can start moving the needle in a single planning cycle.
If you’re looking to cut through the noise around manufacturing AI and get to working solutions, Infocepts can help you focus on the use cases that matter most, pilot quickly, and scale what works across sites without losing local context.
Frequently Asked Questions
Turn Plant Data Into Decisions That Hold
Focused manufacturing analytics and AI agents scoped to real plant decisions — OEE, predictive maintenance, quality, yield, and supply chain resilience, built on a governed OT-IT foundation.
The Infocepts Manufacturing COE partners with industrial and discrete manufacturers to build smarter, data-connected operations. From shop floor analytics and predictive maintenance to supply chain visibility and quality intelligence, the team helps manufacturers move from reactive reporting to real-time decision-making.
Read Full BioRecent Blogs



Infocepts
