


What real-time OEE monitoring reveals, and why weekly reports fall short
What is real-time OEE monitoring?
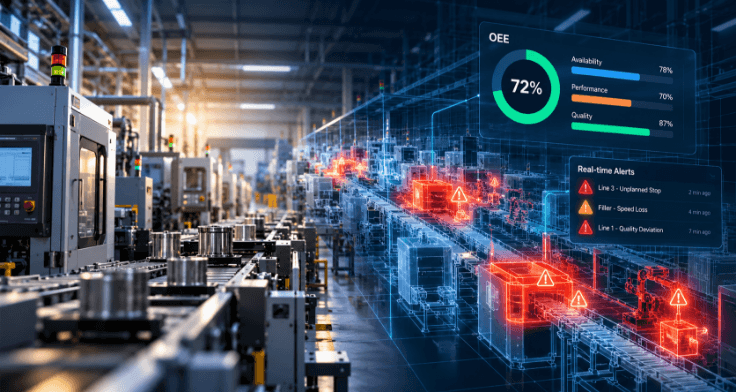
Real-time OEE monitoring shows losses as they happen. Overall equipment effectiveness, or OEE, measures productive time. It multiplies availability, performance and quality. Most plants measure it too late. Weekly reports explain losses after the damage. Our OEE Visibility & Alerting Agent changes that. It works in real time. Plant-wide KPIs refresh every 15 seconds. The target gain is three to five points. That target applies within two quarters.
Every plant has a hidden factory
Walk any shop floor with fresh eyes. You will find the hidden factory. It lives in short stops and slow cycles. It hides in changeovers that run long. It shows up as rework near the end.
None of it looks dramatic. A two-minute jam here. A slower speed there. A few rejects each hour. Yet together, these losses add up fast.
The classic benchmark for great OEE is 85%. Many plants sit well below that mark. The gap is capacity you already own. You paid for it. You are not using it.
Leaders often sense this gap. They feel it in missed shipments. They hear it in overtime requests. They just cannot see where it goes.
Why weekly OEE reports come too late
Most plants do track OEE. The trouble is timing. Data arrives at shift end or week end. Someone builds a spreadsheet. A meeting reviews what went wrong.
By then, the loss is history. The shift is over. The operator has gone home. The root cause is harder to trace.
There is a second problem. Definitions drift between sites. One plant counts planned stops. Another plant excludes them. So the OEE figures do not compare. Leaders end up debating the math. Meanwhile, nobody fixes the loss.
Data also sits in silos. PLCs hold machine states. SCADA holds process values. MES holds orders and counts. ERP holds the cost view. Nobody sees the full picture in one place.
How the OEE Visibility & Alerting Agent works
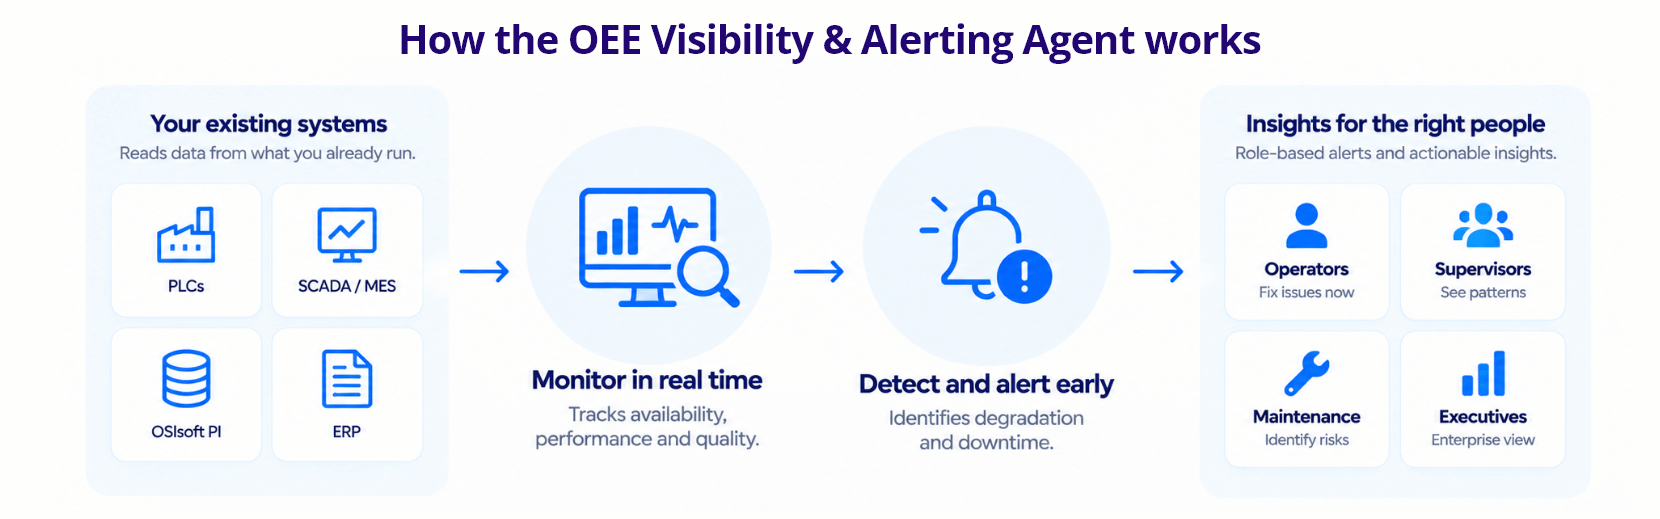
The agent connects to what you already run. It reads PLCs, SCADA and MES. It pulls from OSIsoft PI and your ERP. It works alongside your current systems.
Then it follows six clear steps. It connects your manufacturing systems first. It lets you drill from plant to machine. It monitors availability, performance and quality live. It detects degradation and downtime early. It recommends actions to the right people. Finally, it tracks OEE gains and business impact.
Alerts are role-based. Operators get what they can fix now. Supervisors see shift-level patterns. Maintenance sees asset risks. Executives see the enterprise view. Four scorecards serve these roles.
The agent also attributes every stop. It maps losses to the Six Big Losses. You see breakdowns, setups and small stops. You see speed loss, startup rejects and defects. Losses get ranked by impact. Teams fix the biggest ones first.
From dashboards to decisions
Plants do not lack dashboards. Manufacturing analytics tools are everywhere now. Most plants have too many. Screens glow on every wall. Yet decisions still wait for meetings.
Dashboards describe what happened. The agent suggests what to do next. That shift matters on a busy floor. An operator does not need another chart. They need a clear next step.
Picture a filler slowing by 4% mid-shift. The agent flags the drop within minutes. It links the drop to a worn part. It alerts the line supervisor. The fix happens before the shift ends. The weekly report never sees that loss.
Now multiply that across every line. Across every shift. Across every plant you run. Small saves become a large number. That is what smart manufacturing looks like.
Where most OEE programs go wrong
We have seen many OEE programs up close. Most start with real energy. Many fade within a year. The pattern is familiar.
First, the metric becomes a scorecard. Plants chase a number, not the losses. Teams learn to game the inputs. Planned downtime gets reclassified. The score rises. Output does not.
Second, the data stays manual. Operators log stop reasons by hand. Codes are vague or missing. “Other” becomes the biggest category. Nobody trusts the root causes.
Third, the insight arrives too late. Loss trees take days to build. By then, the week is gone. The team moves on to new fires.
Real-time, automated capture fixes all three. Downtime tracking becomes automatic. Stops are recorded as they happen. Reasons come from system data, not memory. Losses stay visible while they still matter.
What changes on the shop floor?
The morning meeting looks different. Teams stop arguing about whose numbers are right. They open one governed view. They start with the largest loss.
Supervisors spend less time chasing data. They spend more time on the floor. They coach operators on real issues. They escalate faster when needed.
Operators feel the change too. Alerts arrive while they can still act. They see the effect of their fixes. Good work becomes visible. That matters for morale.
Maintenance gets a clearer queue as well. Chronic small stops rise to the top. They stop hiding behind the big breakdowns. Planners can finally address them. Each fix returns minutes to every shift. Over a year, minutes become weeks of capacity.
What results should leaders expect?
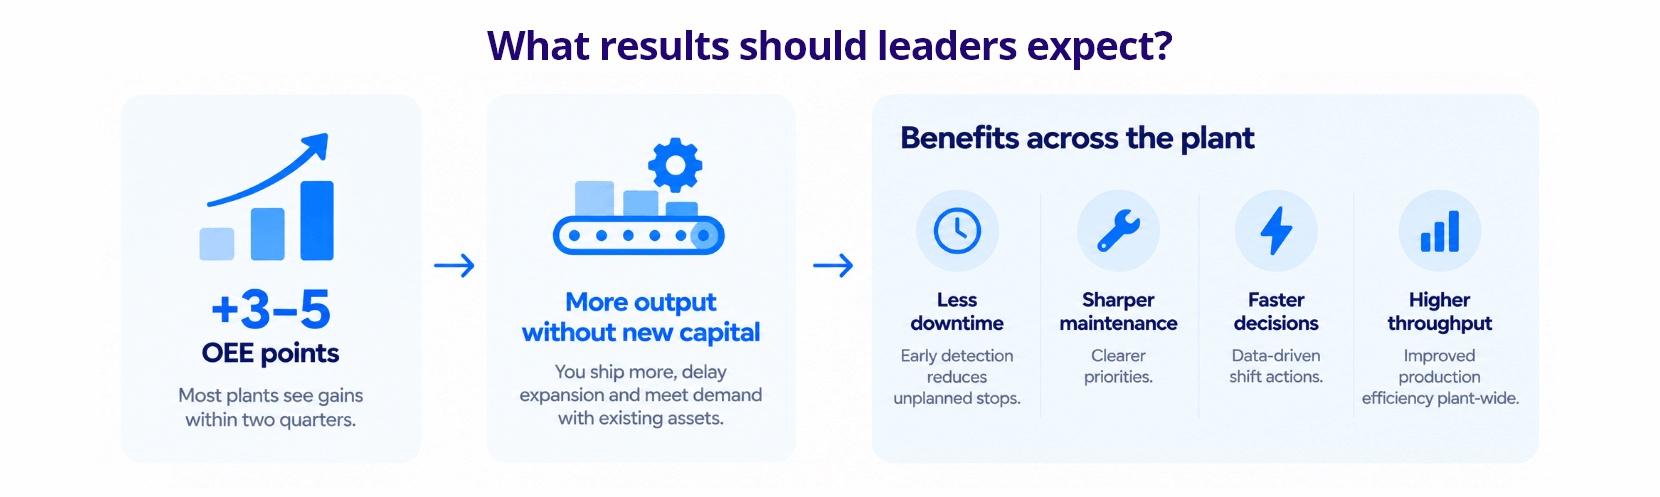
We set targets based on platform benchmarks. Actual gains depend on baseline and data quality. Most plants target three to five OEE points. That gain often lands within two quarters. That is meaningful OEE improvement.
Three points may sound modest. It is not. On a constrained line, it is pure capacity. You ship more without new capital. You delay the next expansion. You meet demand with assets you own.
The benefits spread beyond the line. Unplanned downtime falls with early detection. Maintenance priorities get sharper. Shift decisions get faster. Throughput and production efficiency rise plant-wide.
We have seen what unified data does. One client pulled five systems into one board. Seventy KPIs were ready each morning. Leaders saw them before Europe opened for business.
Why one version of OEE matters
The agent is part of ManuAI. ManuAI is our manufacturing intelligence platform. Eight specialist agents share one semantic layer. That layer holds over 200 pre-built manufacturing KPIs.
Each KPI has one governed definition. So OEE means the same thing everywhere. Ohio and Bavaria finally compare fairly. Plant teams stop arguing over formulas. They start comparing performance with confidence.
The agents also share context. The OEE agent spots a recurring stop. The Predictive Maintenance agent explains the failing asset. The Quality Vision agent shows linked defects. Together, they give a full picture.
A practical path to start
Start with one constrained line. Connect its PLC, SCADA and MES data. Baseline OEE with governed definitions. Then switch on alerts for each role.
Most outcome-based engagements run four to 12 weeks. The agent runs on Microsoft Azure today. It ports to AWS and Google Cloud. It can also run on your own Kubernetes. Security is enterprise-grade throughout. Access is role-based, with full audit trails.
Your hidden factory is running right now
Somewhere on your floor, a line is slowing. A short stop is repeating. No report will show it until next week.
That capacity is yours already. Each shift you cannot see it, it disappears. Competitors who see it first will ship more. They will do it for less.
Infocepts keeps 97.2% of its clients. We are the highest-rated data and analytics provider. That rating comes from Gartner Peer Insights. It has held three years running.
You could have live OEE visibility this quarter. See how the agent maps your losses. Explore the OEE Visibility & Alerting Agent now. Request a demo before 2027 plans lock.
Frequently Asked Questions
Is Your Hidden Factory Running Right Now?
See how the OEE Visibility and Alerting Agent maps your losses, and get live OEE visibility this quarter before 2027 plans lock.
The Infocepts Manufacturing COE partners with industrial and discrete manufacturers to build smarter, data-connected operations. From shop floor analytics and predictive maintenance to supply chain visibility and quality intelligence, the team helps manufacturers move from reactive reporting to real-time decision-making.
Read Full BioRecent Blogs



Infocepts
