


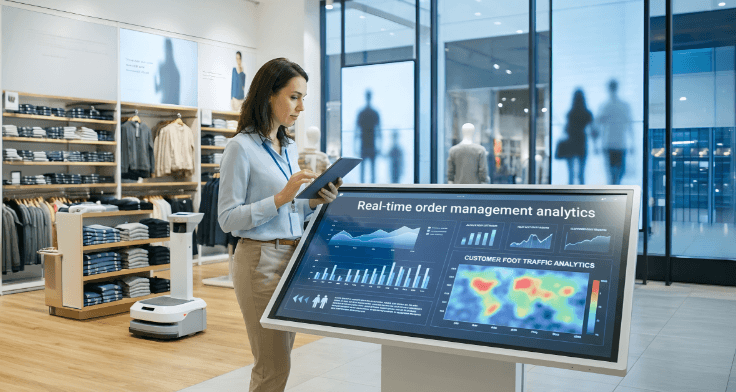
Picture the busiest sale weekend of your year. Orders are pouring in – the app, the website, two marketplaces, and the store on the high street. Somewhere in a back office, a leader hits refresh on a report to see how it’s going. The report is from last Tuesday. It’s about as fresh as the bread nobody bought.
That gap – between what’s happening and what you can see – is the whole ballgame. So here’s the short version:
Retailers get near-real-time visibility into multichannel orders by streaming data out of their order management system (OMS) into a cloud platform, then serving it back as live, role-based dashboards. Order events flow in continuously, land in a cloud data warehouse, and merchandising, supply chain, and store teams see what’s selling – and what’s stuck – within minutes, not next week. Same OMS. New windshield.
The milk-carton problem
Most OMS platforms come with reports baked in. They were built to tell you what already happened – neatly, reliably, and always a little late. Think of them like a carton of milk: fine on day one, iffy by day three, and you really don’t want to base tomorrow’s decisions on them.
Here’s where that hurts, in plain terms:
Want to slice it a new way? That’s a ticket for the IT team and a wait.
By the time a promotion looks like it’s flopping, the weekend’s over. The same lag undermines demand forecasting built on stale inputs. A forecast is only as good as the last snapshot it saw.
Web, app, and store data sit in different reports, so nobody sees the whole picture.
A merchandiser, a supply chain planner, and a store lead all need different cuts, on different clocks – but packaged reporting hands everyone the same static template.
Pulling region-by-region numbers by hand eats analyst weeks.
None of this is a people problem. Your team is smart. They’re just being handed yesterday’s newspaper – one edition, for every reader – and asked to call today’s news.
What “real-time” actually means
Real-time order management analytics is simply this: catching order and sales events as they happen and turning them into numbers your teams can act on immediately. The OMS keeps doing its job – taking and moving orders. A separate layer just watches that activity live and translates it into insight.
If the old way is a printed MapQuest page, real-time analytics is GPS that recalculates the second you miss a turn. Same destination. Wildly different odds of getting there on time.
It’s the same leap health tech made: a yearly checkup tells you what your body did last year; a smartwatch taps your wrist the moment your heart rate spikes. Retailers are moving from the annual-checkup model of data to the smartwatch model – and once you feel the difference, there’s no going back.
How the plumbing works – in three moves
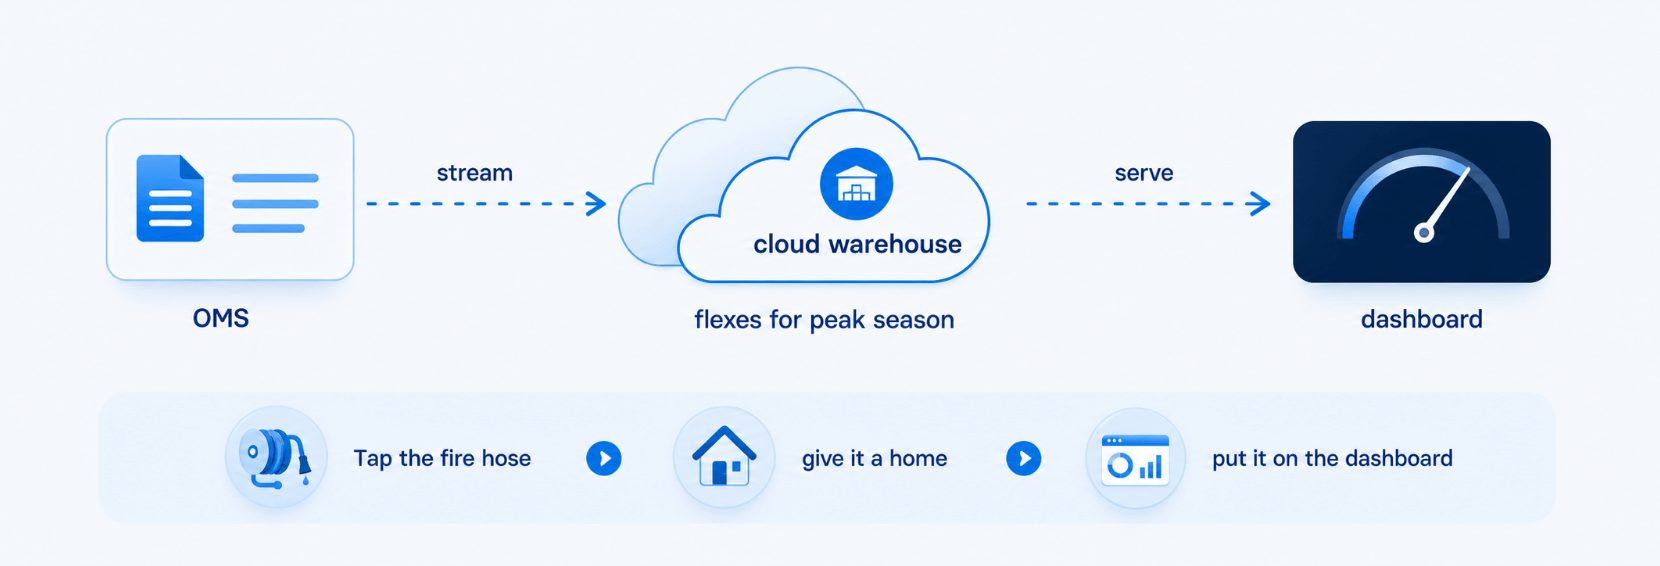
Under the hood it’s less scary than it sounds. Three moves, and you keep the OMS you already own:
- Tap the fire hose: Order and inventory events stream out of the OMS continuously instead of in one nightly dump – the data engineering equivalent of leaving the tap running instead of filling a bucket once a day.
- Give it a home: Those events land in a cloud data warehouse built to swell for Black Friday and shrink for a quiet Tuesday – the heart of a modern data architecture. Moving there is usually a cloud migration project, not a rip-and-replace.
- Put it on the dashboard: Teams see governed, consistent numbers through self-service tools like Decision360 – no SQL, no waiting.
This is the bulk of a data modernization effort, and it’s where an experienced enterprise AI and data partner earns their keep – real-time pipelines are easy to demo and hard to run at scale.
Rear-view mirror vs. windshield
| Area | Legacy / Packaged OMS Reports | Real-Time OMS Analytics |
|---|---|---|
| Data Freshness | Hours to days old | Seconds to minutes |
| New Business Questions | Submit a ticket and wait for changes | Self-service access to insights |
| Channel Visibility | Siloed reports across systems | One unified business view |
| Peak Volume Management | Performance challenges during demand spikes | Scales to support high transaction volumes |
| Tax & Audit Reporting | Manual and time-consuming processes | On-demand, cross-region reporting |
| Decision-Making Speed | Reactive and after the fact | Faster, proactive decision-making |
A true story: the retailer who ditched the weekly wait
A globally renowned luxury apparel retailer had the classic setup: a solid OMS, but reporting stuck in the milk-carton era. Packaged reports only, no live view, and cross-region tax audits that took forever. Leaders wanted to react to a soft promotion or a stuck order the same day — not read about it the following week.
So the fix wasn’t to throw out the OMS. It was to build a near-real-time pipeline that streamed operational order data into the cloud, then hand teams customised, role-based dashboards that went far beyond the old packaged tooling.
Fun footnote for the BI nerds: this is also the kind of project where legacy Cognos reporting gets retired in favour of a modern BI layer — a well-worn Cognos-to-MicroStrategy path, often paired with a move to MicroStrategy Cloud.
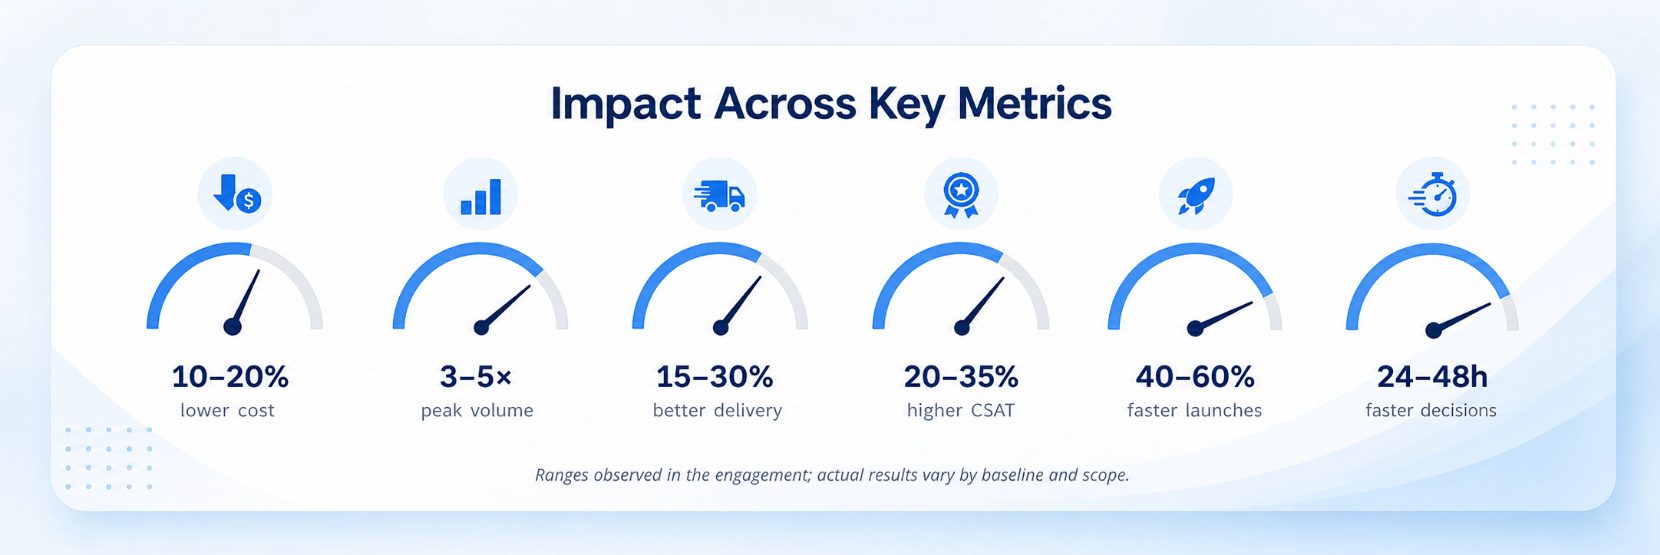
Read those six numbers separately and they’re impressive. Read them together and they’re the actual point: this wasn’t cost or speed or satisfaction – it was all three, at once, from the same fix. Lower cost usually means slower service somewhere else. Faster decisions usually mean someone cut a corner. Here, the cost line went down while the delivery, satisfaction, and speed lines went up – because all four were bottlenecked by the same thing: data that arrived too late to act on. Fix the lag once, and it stops taxing every one of those numbers individually.
A similar shift shows up on the customer side too. See how one retailer moved from broad campaign blasts to individually timed offers in From Mass Marketing to Micro-Moments — same principle, applied to the customer instead of the store.
From “what sold” to “what to do about it”
Real-time order data is brilliant at telling you what is happening and where. But a store manager on a slow Saturday doesn’t need another chart – they need to know why their location is lagging and what one thing to fix before lunch.
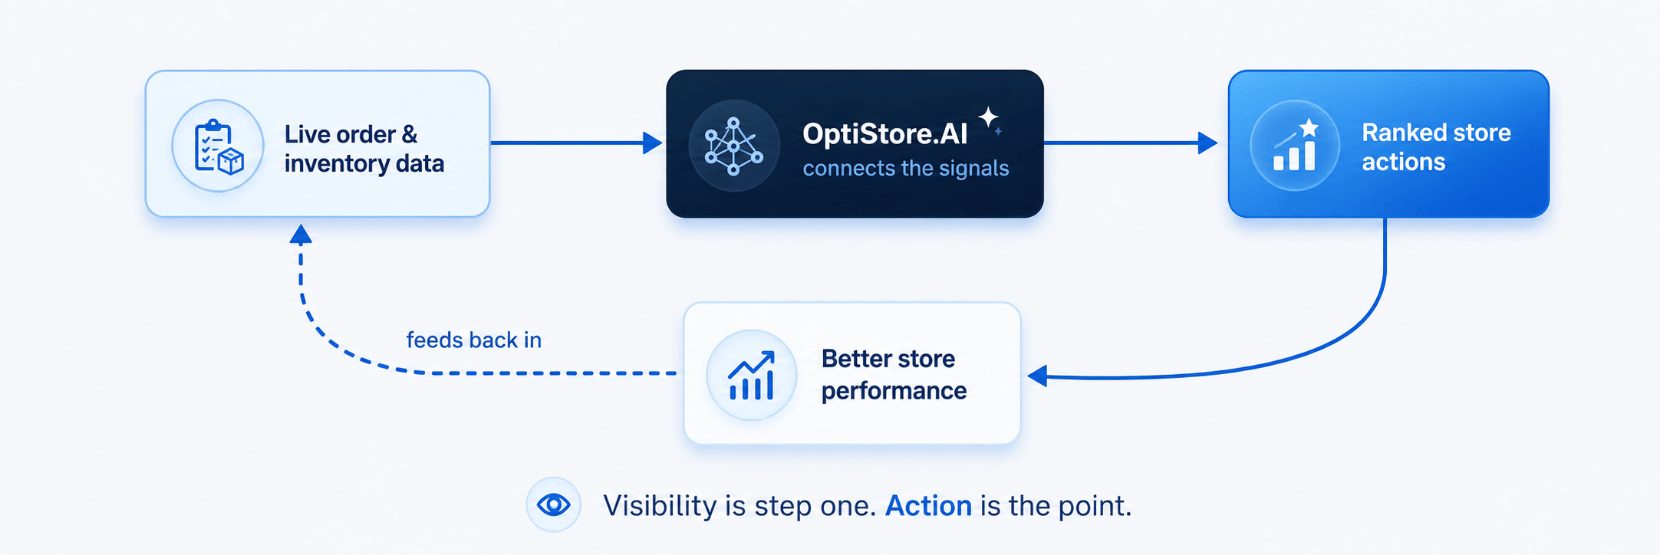
That’s the next rung on the ladder, and it runs on the exact same live data your OMS pipeline now produces. OptiStore.AI – Infocepts’ store-intelligence solution – takes POS, inventory, foot traffic, and merchandising and stitches them into one picture. That same real-time thread is what powers omnichannel customer intelligence to connect what a shopper does online with what they do in-store, instead of treating each channel as its own island.
This is a genuinely useful thing: it hands managers a short, ranked to-do list, sorts stores by how they actually perform, and turns your best shops into a playbook everyone else can copy. Think of it as game film that also tells the coach the next play. This is the same connected-data principle behind Infocepts’ Retail Connected Intelligence approach: merchandising, supply chain, and store execution reading from one shared, governed source instead of three disconnected ones.
Want the full framework? Download the Executive Guide to Decision Intelligence with Conversational Bots and Agentic AI
Infocepts has built this forward-looking retail intelligence stack on the Databricks Data Intelligence Platform as a Databricks Silver Partner with Brickbuilder Specializations in Retail, Consumer Goods & Travel.
Across Infocepts' deployments, OptiStore.
AI has been linked to a 3–5% sales uptick, 3–4% margin gains, and a 5–8% revenue impact across the store network.
Recent Blogs



Infocepts
