


Every retailer with a modern workforce management platform can now predict demand and auto-generate a schedule. That capability used to be a differentiator. It isn’t anymore — it’s table stakes.
Here’s the uncomfortable truth most workforce optimization conversations skip: the forecasting engine inside your scheduling platform was built to work for every retailer, in every category, using general patterns. It doesn’t know that your stores near a university behave nothing like your stores in a retirement community. It doesn’t know that a regional pet-adoption drive or a snowstorm two counties over moves your foot traffic in ways no generic model was trained to see. It’s a good baseline. It is not your competitive edge.
The retailers pulling ahead on labor cost and coverage aren’t the ones with the fanciest scheduling software. They’re the ones who stopped treating the platform’s built-in forecast as the final answer, and started feeding it something better: their own data.
Labor is a forecasting problem before it’s a scheduling problem
Most operations teams jump straight to the schedule — who works Tuesday, who covers the weekend promotion. But a schedule is only as good as the demand signal behind it, and demand signal quality is where the real gap sits.
A generic forecast asks: what does this store type usually need on a Saturday? A precise forecast asks: what does THIS store need THIS Saturday, given THIS promotion, THIS weather pattern, and THIS event happening three miles away?
That second question needs more than a vendor’s out-of-the-box model. It needs a forecasting layer built on the retailer’s own transaction history, footfall data, local event calendars, and category-specific seasonality (adoption surges, back-to-school, holiday gifting) — decomposed down to the task level, not just total headcount. Front-end coverage, fulfillment, and specialty services each have their own demand curve, and treating them as one number is where most labor plans go wrong before they’ve even started.
This is the layer that turns “predict sales” into “predict the exact labor mix, by role, by hour” — and it’s the layer that’s almost always underbuilt, because it’s easier to accept what the WFM platform gives you by default.
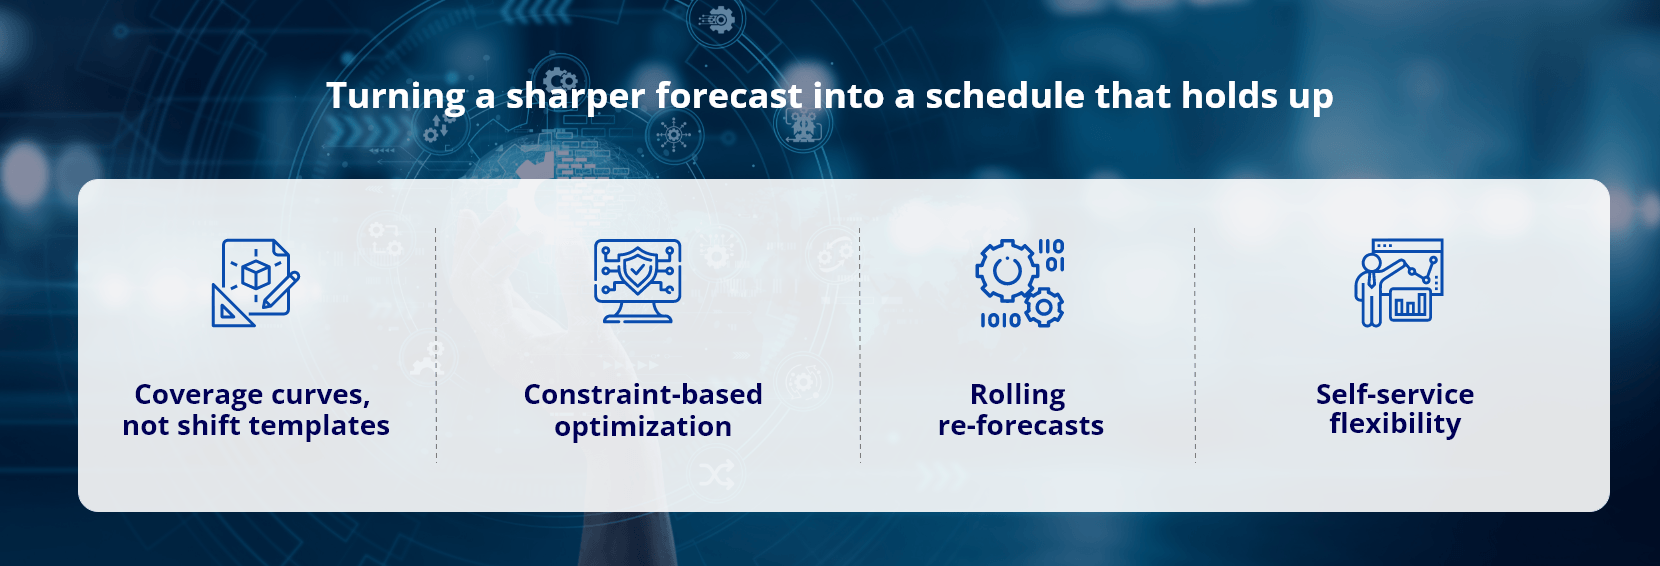
Turning a sharper forecast into a schedule that holds up
A better forecast only pays off if it actually reshapes the schedule, not just the reporting dashboard. In practice, that means:
- Coverage curves, not shift templates. Building shift blocks that mirror the actual demand shape — staggered, shorter shifts around known peaks — instead of defaulting to standard full-day blocks.
- Constraint-based optimization that balances demand coverage, compliance rules, associate availability, and cost ceilings simultaneously — a problem too multidimensional for manual scheduling or spreadsheets to solve well at scale.
- Rolling re-forecasts, refining the schedule 48–72 hours out as real signals replace projections, when accuracy is highest.
- Self-service flexibility — shift marketplaces where associates pick up, swap, or release shifts within guardrails, absorbing last-minute variability without pulling a manager off the floor.
Done right, this shifts the store manager’s job from building the schedule to managing the exceptions in it — a small phrase that represents a large amount of time given back to actually running the store.
The role mix is where efficiency is won or lost
Even a precise forecast fails if the underlying workforce can’t flex to meet it. The retailers getting this right design a deliberate mix of:
- Core, tenured associates anchoring consistency and complex customer interactions.
- Flexible, part-time associates whose availability is explicitly matched to volatile peak windows, not treated as a scheduling afterthought.
- Cross-trained associates certified across front-end, fulfillment, and specialty services — so one labor pool can absorb demand shifts between functions instead of requiring separate headcount for each.
- Skill-aware scheduling logic, so the system isn’t filling hours — it’s filling hours with the right skill for that hour’s task mix.
There’s no universal ratio here. The right mix depends on a store’s volatility profile, service complexity, and local labor market. But the principle holds everywhere: the more cross-trained and flexible the base, the less a retailer needs to over-hire “just in case” — which is exactly where labor cost as a % of sales quietly erodes.
Where the platform layer fits — and where it doesn’t
Modern workforce management platforms, UKG Cloud among them, are genuinely strong at what they’re built for: running the schedule at enterprise scale. UKG’s WFM engine forecasts demand down to short intervals, recommends best-fit associates for open shifts based on availability and certifications, automates compliance checks against fair workweek and overtime regulations across jurisdictions, and gives store and district leaders real-time visibility into labor cost and coverage. Platforms like Dayforce, Workday, and Blue Yonder occupy similar ground, each with their own strengths depending on scale and existing HCM footprint.
That’s the execution layer, and it matters — a great forecast with no reliable way to turn it into a compliant, adoptable schedule is just an interesting spreadsheet. But execution isn’t where the competitive advantage lives. The advantage lives one layer upstream, in the forecasting model that feeds the platform. A retailer that connects its own lakehouse of transaction, traffic, and local-event data into the scheduling engine — rather than relying solely on the platform’s generic model — is working with a materially sharper signal. Same platform, same execution muscle, a fundamentally better input.
This is also where AI is adding the most new value beyond the base forecast:
- Continuous learning loops — models that retrain on forecast-versus-actual variance store by store, rather than applying one national model everywhere.
- Manager copilots — natural-language interfaces letting a store lead ask “why is Thursday overstaffed?” instead of digging through static reports.
- Anomaly and risk detection — flagging schedules likely to trigger compliance exposure or attrition risk (chronic under-scheduling, clopening patterns) before they become a problem.
- Scenario simulation — modeling a new promotion, format change, or wage shift against labor cost and coverage before committing to a plan.
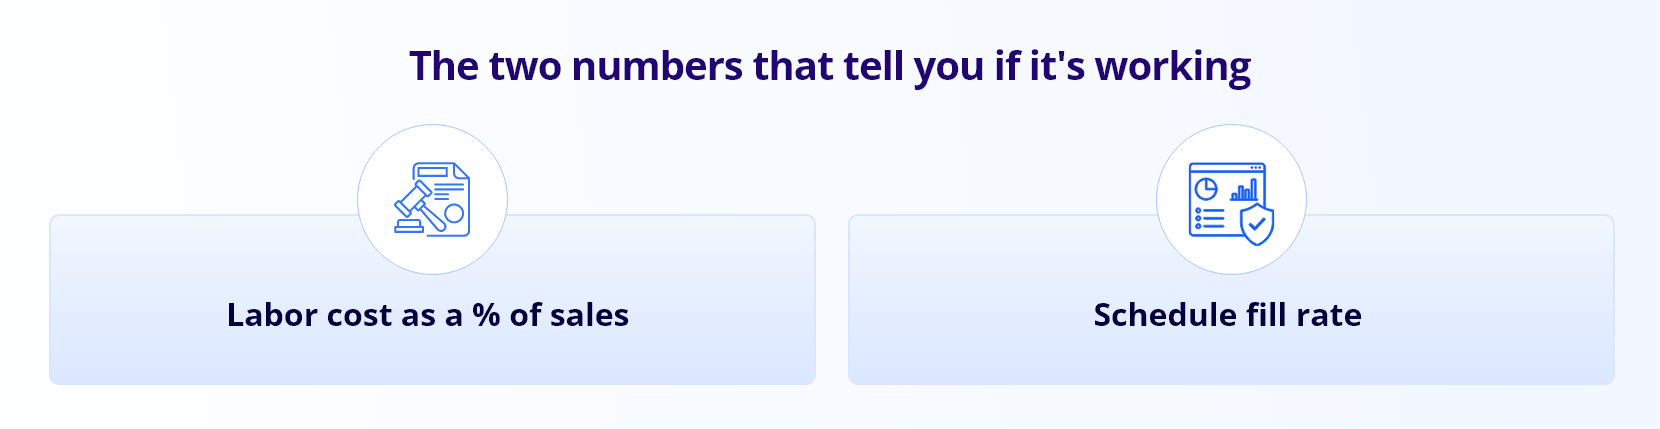
The two numbers that tell you if it’s working
Everything above should move two KPIs, and if it isn’t, the initiative isn’t finished:
- Labor cost as a % of sales — the cost-efficiency lens, tracked against forecast accuracy so cost swings trace back to demand misses rather than scheduling failure alone.
- Schedule fill rate — the coverage-quality lens, measuring how consistently the planned schedule (right role, right time) is actually filled, which is a more honest signal of operational health than headcount alone.
Retailers that track both together — instead of optimizing cost at the expense of coverage, or coverage at the expense of cost — see the compounding benefit this is meant to deliver: lower cost, better service, and a measurable lift in associate satisfaction, since well-matched schedules are one of the strongest levers against frontline burnout and turnover.
The takeaway
The scheduling platform is no longer the differentiator — everyone has one. The differentiator is what feeds it. Retailers who invest in a forecasting layer built on their own data, and connect it directly into their workforce platform’s scheduling engine, are the ones turning workforce optimization from a cost-control exercise into a genuine operating advantage.
If you’re evaluating where your own workforce optimization program sits on that spectrum — running on the platform’s default forecast, or running on your own — that’s a conversation worth having. Get in touch with our team to talk through what a custom demand-forecasting layer could look like for your stores.
Frequently Asked Questions
Is Your Workforce Plan Running on a Generic Forecast?
Talk through what a custom demand-forecasting layer built on your own transaction, traffic, and local-event data could do for labor cost and schedule fill rate across your stores.

Author
Dipti Loya is a Delivery Manager in the Retail & Consumer practice at Infocepts, bringing 19 years of experience driving data and AI led transformation. she owns delivery governance, client stakeholder management, and solution strategy, while nurturing talent and driving innovation led growth. Her expertise in data and AI strategy makes her a trusted partner to clients navigating enterprise scale change. Outside work, she enjoys travelling, reading, and keeping pace with emerging trends in data, AI, and retail technology.
Read Full BioRecent Blogs



Infocepts
