


Supply chain analytics stops being a buzzword the moment a truck is late, a key component is out of stock, and your team is juggling spreadsheets at midnight. When manufacturers and retailers treat supply chain analytics as a core capability, they cut cost, reduce risk, and make better calls long before a disruption hits.
The problem is never “lack of data.” The real problem is scattered systems, manual reports, and no common view of what is actually happening from supplier to customer. This article walks through how leading organizations use data, from supply chain AI pilots to very practical dashboards, to change how decisions get made every day.
Why Supply Chain Analytics Matters More Than Another Spreadsheet
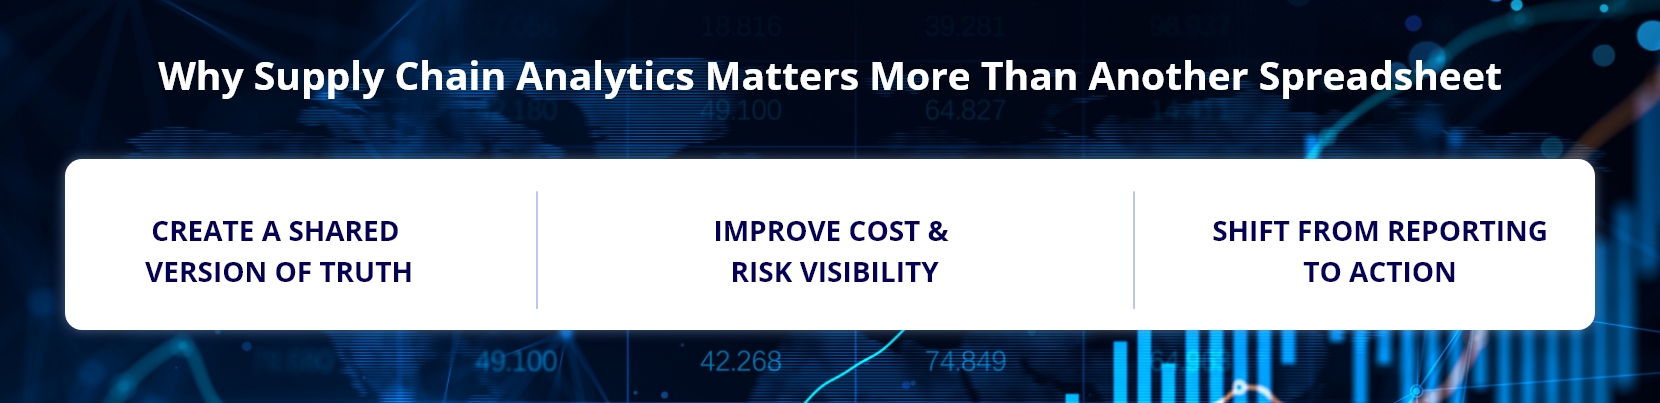
Most operations leaders don’t need more reports; they need fewer arguments about what those reports mean. Supply chain analytics creates a shared version of truth that finance, planning, logistics, and sales can all trust.
On the cost side, that shared truth exposes freight waste, bad order minimums, and inventory that quietly ages in the wrong warehouse. On the risk side, it makes supplier exposure, capacity gaps, and demand volatility visible enough that you can act before the next disruption, not after.
From Static Reports To Continuous Supply Chain Intelligence
Legacy monthly reports describe what happened. By the time they hit your inbox, the damage is done. Modern supply chain intelligence combines historical data with near real-time signals from ERP, WMS, TMS, and even external feeds like weather or port congestion.
The shift is simple but powerful: instead of asking, “What went wrong last quarter?” teams ask, “What decision do we need to make in the next 24–72 hours, and what data supports that choice?” That focus reshapes which metrics you surface and how often you revisit them — and it is the operating premise behind SupplyChain360.
Using Supply Chain AI Where It Actually Pays Off
There’s plenty of noise around supply chain AI, but only a handful of use cases consistently pay back the investment. The common thread: they automate decisions that humans either make too slowly or too inconsistently, especially where the data set is too large for Excel to handle.
Start with a high-volume, repeatable decision rather than a moonshot project. That could be order promising, truckload consolidation, or daily safety stock tuning for your top 500 SKUs.
Where Supply Chain Analytics Pays Back Fastest
| Use case | Decision it changes | Data you need | Typical payback |
|---|---|---|---|
| Demand and supply alignment | Adjust production mix before customers feel a shortage | Historical shipments, forecast, confirmed orders, line capacity, material availability | A quarter or two — no new sensors required |
| Inventory parameter cleanup | Reset lead times, order minimums, and service targets to reality | Actual lead times, MOQs, current service levels | 5–10% of working capital freed without raising stockouts |
| Defect pattern analysis | Isolate two or three controllable quality drivers | Batch and lot records tied to machine, shift, supplier lot, changeover | Fast — often before any vision AI investment |
| Load consolidation and routing | Combine partial loads; tighten routing guides | Orders, carriers, routes, accessorial charges | Direct freight savings once patterns are visible |
| Scenario modelling | Pick the cheapest mitigation for a supply slip | Prebuilt scenarios over the forecast and capacity baseline | Hours instead of a fresh model per executive question |
| Procurement spend analysis | Consolidate fragmented volume; expose single-source risk | PO, contract, and quality data, classified by category | Better terms at the next negotiation cycle |
Notice what the top rows have in common: none of them requires new instrumentation. The fastest returns come from data you already collect, used against a decision you already make.
High-Impact Use Cases For AI Models
For manufacturers, AI models can improve demand forecasting for items with promotional or highly seasonal patterns where simple averages fail. Retailers often apply AI to assortment decisions, pricing moves, and replenishment for long-tail products where human planners don’t have enough time or clean history — the problem supply chain forecasting is built around.
The mistake many teams make is trying to retrofit AI onto bad source data. Before any model goes live, invest in standardizing product hierarchies, cleaning location codes, and agreeing on a single calendar for planning data.
Planning Better With Demand Forecasting And Scenario Modeling
Every planner knows that demand forecasting is wrong; the goal is to be less wrong in a predictable way, then plan buffers and capacity around that. Good analytics does two things: improves the baseline forecast and makes forecast error obvious, not hidden in a cell on tab 14.
Instead of arguing about a single forecast number, leading teams use forecast ranges, service targets, and clear rules for when humans can override the system. That transparency improves trust and speeds up S&OP or IBP meetings.
Scenario Planning That Reduces Fire Drills
Scenario modeling takes the same demand forecasting foundation and asks, “What happens if…?” What happens if a key supplier’s lead time doubles, if fuel jumps 20%, or if a promo lifts volume by 40% instead of 10%?
Analytics teams prebuild a small set of recurring scenarios tied to executive questions. That way, when leadership asks for a new plan, they can re-run assumptions in hours instead of building a fresh model from scratch every time. A supply chain resilience agent exists to keep that capability running rather than rebuilt per crisis.
From “Too Much Stock” To Smart Inventory Optimization
Most manufacturers and retailers carry excess stock in some nodes and painful shortages in others. Inventory optimization analytics aims to rebalance that, not by pushing everyone to the lowest possible days-on-hand, but by matching stock levels to real service and risk priorities.
The first practical win is usually cleaning up basic parameters: lead times, minimum order quantities, and service targets. Just aligning those to reality can free up 5–10% of working capital without increasing stockouts.
Translating Models Into Planner-Friendly Rules
The best inventory optimization projects don’t bury planners in math. They translate stochastic models into understandable rules: which SKUs deserve higher safety stock, which can live with less, and where to hold that buffering in the network.
Teams that succeed set up monthly reviews to compare recommended versus actual policy and use analytics to explain why certain items drove most of the backorders or write-offs last quarter.
Logistics, Procurement, And Visibility: Where Data Fixes Daily Pain
Too many logistics teams run their operation through email threads and phone calls, then do “analytics” in a pivot table on Fridays. Logistics analytics brings together orders, carriers, routes, and accessorial charges so managers can see patterns, not just exceptions.
Typical wins include consolidating partial loads, tightening routing guides, and spotting lanes where carriers miss service targets but still win freight, often because no one has a clear dashboard in front of them. In distribution specifically, that is the job of a DC intelligence decision hub.
Improving End-To-End Supply Chain Visibility
Supply chain visibility is less about pretty maps on a wall and more about getting the right status data to the right role at the right time. Planners need projected inventory positions, customer service needs promise dates, and transportation teams need dwell times and ETA reliability.
The quickest way to real progress is to define a small number of golden signals, such as late orders, capacity utilization, and lead time drift, then build alerts and views around those instead of trying to represent every single event in the chain. How fresh those signals actually need to be is worth deciding deliberately — see real-time data analytics.
Smarter Sourcing Through Procurement Analytics
Procurement analytics often starts with spend classification and supplier performance, then matures into risk and collaboration insights. By structuring PO, contract, and quality data, teams can see where single-sourced items create exposure and where volume is too fragmented to get good terms.
Over time, this enables fact-based conversations with suppliers around price, service, and innovation rather than haggling over last year’s quote in isolation.
Building A Practical Supply Chain Data Foundation
No advanced model survives contact with messy master data. Before chasing the next buzzword, leading organizations invest in a supply chain data foundation that is boring, reliable, and shared across functions. Product and location hierarchies are exactly the entities master data management is designed to govern.
That foundation includes conformed dimensions for products and locations, common definitions for KPIs, and a clear process for how new data sources are added or changed so analytics doesn’t break every time IT updates a system. What that costs and returns at platform scale is set out in the business case for an AI-ready supply chain data platform.
From Dashboards To Integrated Supply Chain Planning
Once the basics are in place, companies connect their analytics layer directly to supply chain planning workflows. Instead of planners exporting reports and rekeying numbers, planning systems read forecast errors, capacity constraints, and service performance directly from the analytics stack.
This closed loop tightens feedback: decisions in planning create results in operations, those results show up quickly in analytics, and teams refine policies based on real performance instead of gut feel or dated rules of thumb.
Where Infocepts Fits
Infocepts builds supply chain analytics on a governed data foundation shared across planning, logistics, and procurement, rather than as separate dashboards per function.
- Rated #1 Data & Analytics provider on Gartner Peer Insights, three years running, with 97.2% client retention across 20+ years of delivery.
- A named platform in SupplyChain360, with vertical solutions for both sides of this article — retail supply chain forecasting and a manufacturing supply chain resilience agent.
- Documented outcomes, including 10% cost savings and 12% delivery gains and real-time supply chain resilience in life sciences.
The Bottom Line
Supply chain analytics pays off when it is anchored in real decisions, not in dashboards for their own sake. Manufacturers and retailers that treat data as a common language across planning, logistics, and procurement cut cost and risk while reducing the constant firefighting.
If you’re ready to move in that direction, start small, focus on one or two high-impact use cases, and build from a clean data foundation.
Frequently Asked Questions
Cut Cost And Risk, Not Just Reporting Cycles
Supply chain analytics anchored in real decisions - governed product and location data, prebuilt scenarios, and golden signals routed to the role that acts on them.
Recent Blogs



Infocepts
