



Your teams don’t need another dashboard; they need advertising analytics that tell them which decisions will actually move revenue and keep audiences engaged. If you’re stitching reports together in spreadsheets or guessing which formats to push, you’re leaving real money on the table.
Most publishers have the same problem: the data exists across ad servers, SSPs, CDPs, and analytics tools, but no one trusts a single view enough to change pricing, layout, or sales strategy. This article walks through a practical way to fix that, without rebuilding your entire ad tech stack — the same discipline behind Infocepts’ advertising revenue and yield optimization portfolio.
Why Advertising Analytics Often Fail Publishers
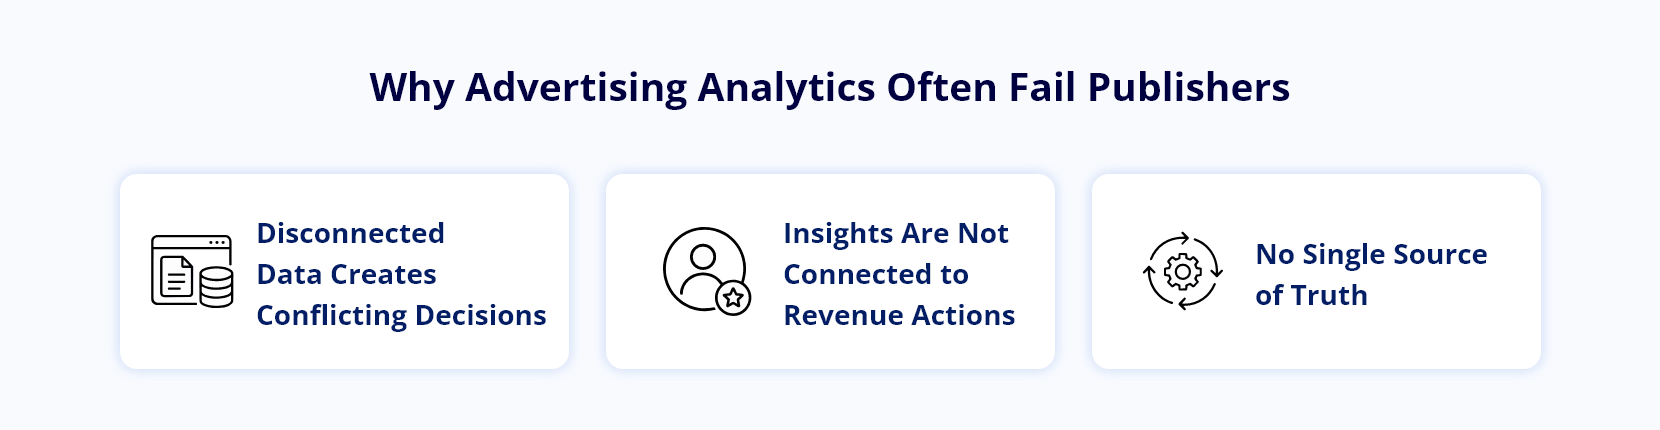
Plenty of teams invest in advertising analytics but still miss their revenue targets. The issue usually isn’t a lack of data; it’s that the data is noisy, delayed, and disconnected from decisions like pricing and packaging.
One common pattern is that yield or operations teams watch fill rate and eCPM in isolation, while product and audience teams track engagement and churn. When those views don’t line up, the organization defaults to opinions instead of evidence.
The Real Cost Of Fragmented Reporting
When every department builds its own reports, you don’t just waste time. You get conflicting answers to basic questions such as which channel deserves the next campaign push. Without aligned media analytics, sales teams promise inventory that product teams quietly know underperforms.
The result shows up quickly: CPM discounts, over-delivery to hit guarantees, and internal arguments about which “truth” to believe. None of that helps you grow revenue or protect the audience experience. It’s the same fragmentation problem CTV advertising runs into at a larger scale, once inventory splits across linear, digital, and streaming at once.
Building A Publisher Analytics Foundation That Actually Works
Before you chase advanced models, fix the basics. A solid publisher analytics foundation starts with clean identifiers for inventory, users, and campaigns, and a clear definition of the KPIs your business actually runs on.
Start by mapping where each critical metric currently comes from: ad server, SSP logs, analytics platform, consent tool, or subscription system. Then agree on a single owner for each KPI so arguments can’t drag on for weeks every time performance dips.
Unifying Revenue And Audience Signals
A strong foundation means revenue and engagement live in the same environment. That’s non-negotiable if you want credible audience analytics that explain why one placement wins and another drags. You should be able to answer, in a few clicks, how changes to ad density impact scroll depth and return visits.
Ideally, you model a basic user journey: first touch, article depth, exposure to different formats, and eventual subscription or bounce. When those events share the same IDs and timestamps, your team stops arguing about what happened and starts arguing about what to do about it — which is where the value is.
From Data To Ad Revenue Optimization
Once the foundation is in place, the next step is to turn all that measurement into ad revenue optimization, not just nicer reports. This is where publishers usually jump straight to machine learning and skip the low-hanging fruit.
Begin by benchmarking each ad unit and template. For every key placement, track revenue per thousand pageviews, viewability, and basic engagement impact. That gives you a side-by-side view of which layouts pull their weight and which ones quietly tax the audience for very little gain — the ongoing work a platform like Inventory Optimization Multiplier is built to automate.
Optimization Levers Worth Testing First
| Lever | What you test | What you measure | Typical run |
|---|---|---|---|
| Ad density | One fewer ad slot vs. control pages | Revenue per session, scroll depth | 4–6 weeks |
| Format mix | Shift impressions from low-viewability banners to sticky or in-article units | Viewability, revenue per session | 4–6 weeks |
| Floor price tiers | Structured price experiments by geo and device | Fill rate, eCPM | 4–6 weeks |
| Content-type splits | Quick reads vs. long features, separated | Ad tolerance, sponsorship performance | 4–6 weeks |
Run these consistently and log each test with a start date, hypothesis, and decision rule. Without that discipline, you’ll keep relitigating the same ideas every quarter and your supposed wins will quietly erode. A focused set of tests like this typically uncovers 5–10% revenue upside without hurting user metrics.
Using Media Intelligence To Guide Sales And Product
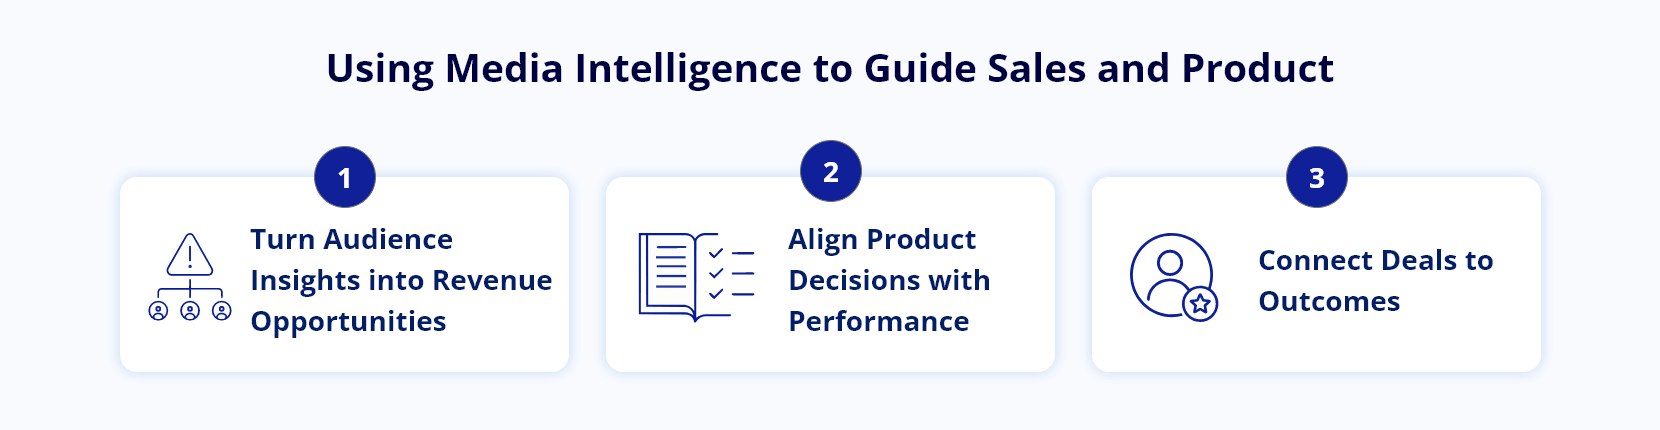
Good analytics shouldn’t just help the ad ops team; it should reshape how you package and sell inventory. With thoughtful media intelligence, your sales team walks into pitches with proof, not just rate cards and screenshots — the same proof point behind how one global media company cut ad sales prep time 30% using account and campaign intelligence at the point of the pitch.
For example, if the data shows that readers who see mid-article video spend 40% longer on page and click more sponsored links, that’s a compelling narrative for a “high-attention” package. It also gives product a reason to prioritize that template over formats that upset readers without adding value.
Closing The Loop Between Deals And Performance
Most publishers still treat direct deals as separate from programmatic. That separation hides whether your premium offerings actually outperform the open market. With integrated advertising yield optimization, you can compare guaranteed campaigns against similar programmatic impressions for the same audiences and placements — the pacing discipline CampaignNova Autopilot applies continuously rather than at the end of a flight.
That comparison tells you if your sponsorships are underpriced, which audience segments really deserve custom programs, and where sales is giving away “premium” inventory that doesn’t behave any differently in practice.
Making Media Data Analytics Operational
Dashboards don’t change behavior on their own. To get value from media data analytics, you have to wire insights into the weekly routines of ad ops, product, and sales. Otherwise, your best analysis lives in quarterly review decks and nowhere else.
Start small: define three recurring questions for each team that the data must answer every week. For ad ops, it might be which slots dropped viewability — the exact gap AdSentinel is built to catch before an advertiser notices. For product, which templates hurt time on page. For sales, which segments over-delivered against brand KPIs.
Designing Reports People Actually Use
Avoid the 20-widget “everything view” that tries to serve every stakeholder at once. Focused reporting, tied to decisions, turns media business intelligence from a background tool into something people actually open before meetings.
A useful pattern is a layered approach: a simple summary page with 5–7 tiles answering “Are we on track?” and a few drill-down views for those who need more depth. Keep exports easy so teams can pull slides without manually rebuilding graphs.
Where Infocepts Fits
Infocepts builds advertising analytics as a governed measurement layer feeding pricing, packaging, and sales decisions — not a reporting layer sitting beside them.
- Rated #1 Data & Analytics provider on Gartner Peer Insights, three years running, with 97.2% client retention across 20+ years of delivery.
- A named portfolio for this exact problem — advertising revenue and yield optimization, spanning inventory forecasting, delivery pacing, and endpoint monitoring.
- Proven on the sales side too, cutting ad sales prep time 30% for a global media company by putting account and campaign intelligence in front of sellers before the pitch.
The Bottom Line
Strong advertising analytics aren’t about prettier charts; they’re about consistently making decisions that protect audience loyalty and grow revenue at the same time. When you align data across teams, run disciplined experiments, and connect insights to daily routines, your ads strategy becomes far less reactive.
If you’re ready to move beyond basic reports and treat advertising analytics as a core capability, now is the moment to reassess your data foundation, test plan, and decision workflows.
Frequently Asked Questions
Turn Advertising Analytics Into Revenue, Not Reports
Unify revenue and audience data, run a disciplined test plan, and wire insights into the weekly routines of ad ops, product, and sales - the same yield discipline behind Infocepts' media and entertainment portfolio.
The Infocepts Media & Entertainment COE helps streaming, publishing, and content businesses harness data to grow audiences and optimize revenue. The team specializes in content analytics, subscriber intelligence, ad tech data, and building the data foundations modern media companies need to compete.
Read Full BioRecent Blogs



Infocepts
