


Growth is easy to plan. Expansion is hard to execute — and nowhere is that more visible than in retail site selection.
For most retailers, “where should we open next” starts as a simple question, answered with market familiarity and gut instinct. It stops being simple the moment a brand is running a real estate pipeline against hundreds of candidate sites across multiple trade areas and countries at once. At that scale, intuition doesn’t fail because it’s wrong — it fails because it can’t hold a portfolio’s worth of trade-area math in one head. That’s the exact gap site selection built on location intelligence is designed to close.
Every new location is a capital allocation decision. A good one captures demand inside its catchment, hits sales productivity targets per square foot within a normal ramp period, and strengthens the brand’s footprint against nearby competitors. A bad one cannibalizes an existing store’s comps, drags on four-wall economics, and sits as an underperforming asset on the real estate committee’s watch list. Multiply that decision by a few hundred candidate sites across a dozen markets, and site selection stops being a real estate exercise and becomes a data science problem with real estate consequences.
Why Spreadsheets Stop Working
Traditional site selection runs on a mix of local market expertise, spreadsheets, and reports pulled from disconnected systems — demographic extracts here, competitive audits there, POS and loyalty data somewhere else entirely. That works fine when a real estate team is underwriting five or ten deals a year, because a sharp regional lead can hold the trade-off between rent, drive-time, and demand generation in their head. It breaks down once the pipeline scales, because every site needs to be scored on the same underwriting criteria — trade-area population and density, household income and spend-per-capita, psychographic and lifestyle segmentation, existing co-tenancy and anchor draw, competitive saturation, and drive-time or walk-time accessibility — and reconciling all of that by hand turns into weeks of manual underwriting per market.
Worse, it turns into weeks of inconsistent underwriting. One analyst leans on a Huff-style gravity model to estimate demand capture; another sizes the opportunity off raw population density because that’s what worked in the last trade area they scored. Neither approach is wrong on its own, but neither produces numbers that are comparable across a real estate pipeline, and a portfolio-level expansion plan lives or dies on comparability, not on any single analyst’s read of a single trade area. The result is a familiar failure mode: underwriting criteria that shift market to market, site-approval cycles measured in weeks instead of days, and a real estate committee greenlighting seven-figure lease commitments off partial, unevenly-gathered market intelligence — with real cannibalization risk against the existing store network going unmodeled until after the LOI is signed.
The Shift: From “Where Can We Open” To “Where Should We Open, And Why”
Location intelligence closes that gap by fusing geodemographic, trade-area, and retail performance data into a single evaluable layer — so a candidate site isn’t underwritten in isolation, but scored against the demand generation, competitive saturation, and cannibalization risk actually surrounding it. That reframes the underwriting question from a binary feasibility check into a comparative, portfolio-aware capital allocation decision — and a reframed question produces a defensible pro forma instead of a confident guess. It’s the same shift interactive geospatial analytics made for retail space profitability more broadly.
The Challenge: One Global Footwear And Apparel Brand
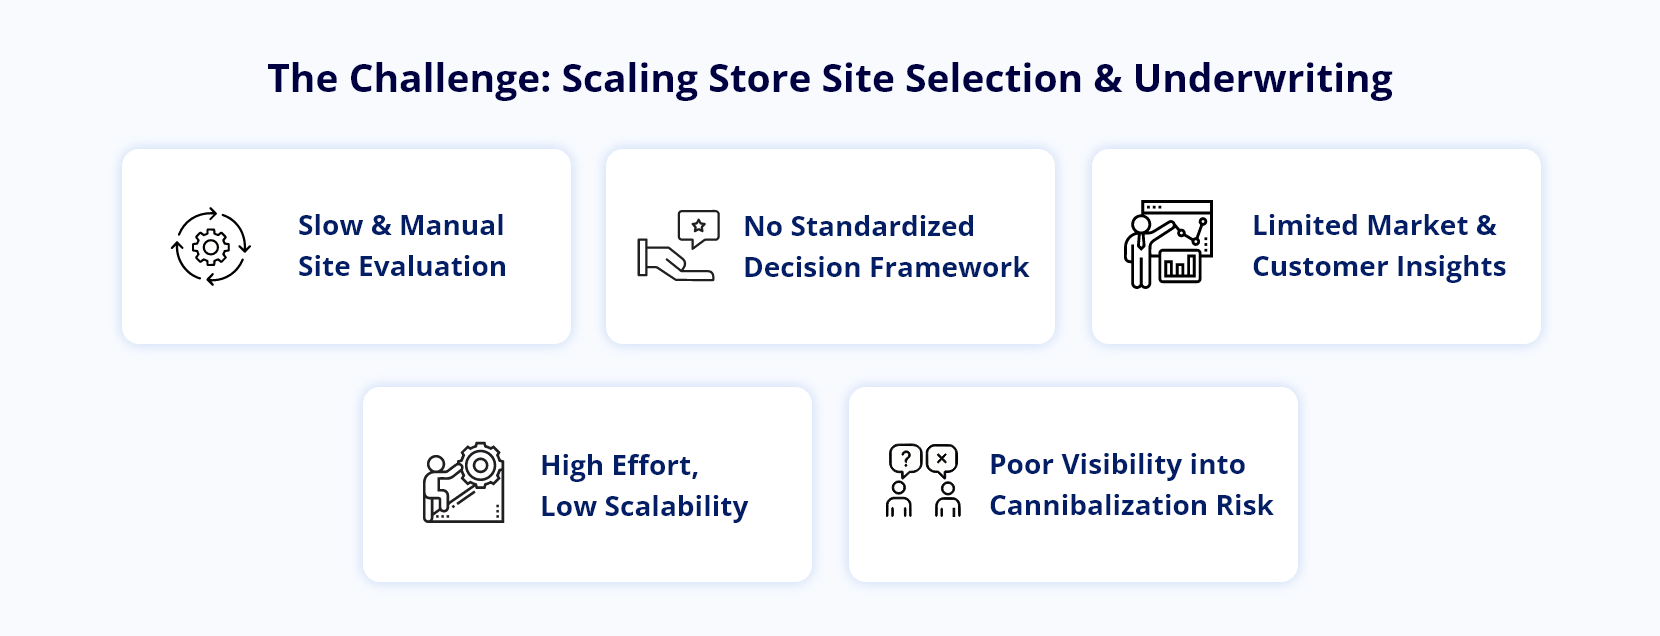
A global footwear and apparel brand hit this wall as its store growth targets outgrew its site-selection process. Underwriting was manual and market-by-market: teams pulled demographic and trade-area data from scattered sources, ran competitive and whitespace analysis independently by region, and compared opportunities without a shared scoring model or a consistent view of cannibalization exposure across the existing fleet. It produced real market intelligence — just not fast enough, and not standardized enough, to keep pace with an aggressive multi-format, multi-geography rollout.
Leadership needed a repeatable, standardized underwriting framework that would let the team:
- Surface high-potential trade areas and whitespace faster, across formats (flagship, mall, strip, outlet)
- Score candidate sites against a consistent set of weighted underwriting criteria
- Get better visibility into geodemographic and psychographic trends shaping each trade area
- Cut the manual effort that went into every site feasibility study and pro forma
- Model cannibalization risk against the existing store network before capital commitment, not after
The Build: A Single Source Of Truth For Expansion
Infocepts partnered with the brand to build a Smart Site Selection platform — not another reporting layer, but a centralized retail analytics environment that fuses geodemographic data, trade-area and drive-time modeling, psychographic and consumer segmentation, existing store performance and comp data, competitive and co-tenancy intelligence, and geospatial layers into one system of record for expansion planning.
Four Views Inside The Smart Site Selection Platform
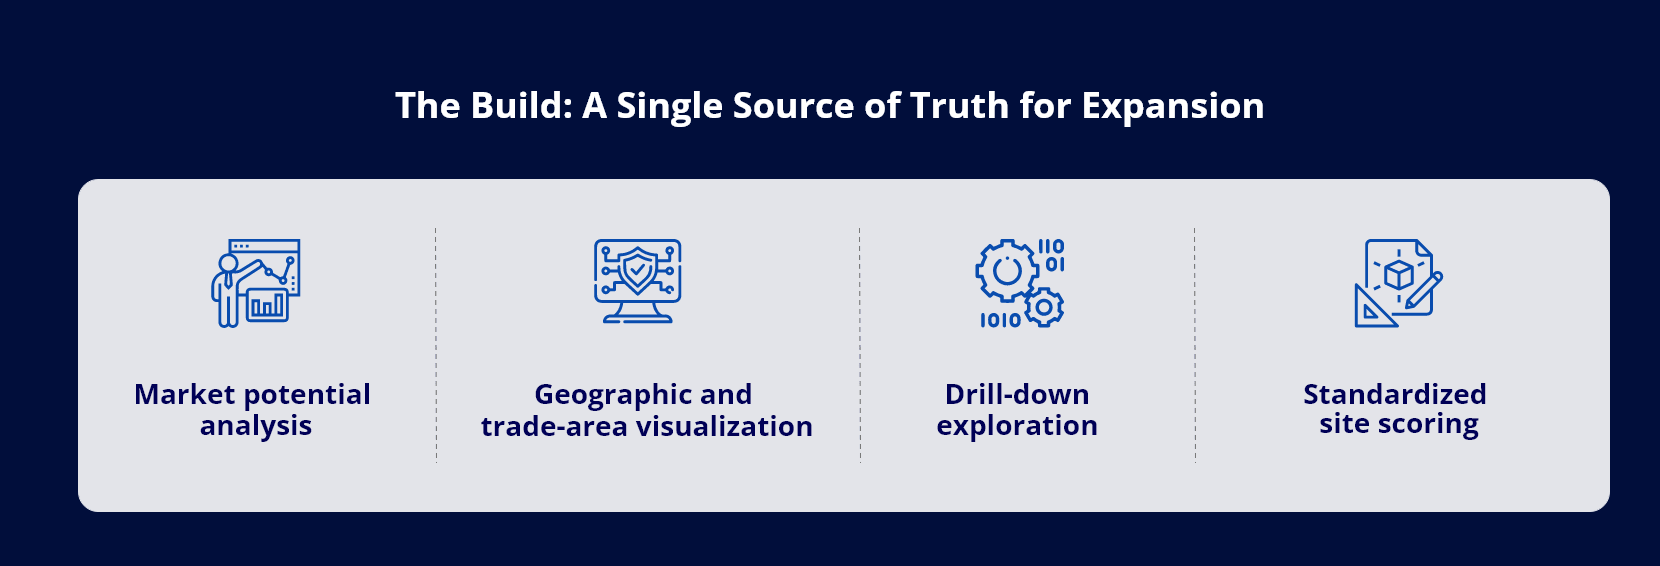
| View | What it answers | What it replaces |
|---|---|---|
| Market potential analysis | Where is demand growing before a market looks obviously saturated — read from spend-per-capita and population trends, not static census snapshots | Point-in-time demographic extracts |
| Trade-area visualization | Where does a candidate site overlap an existing one, and how does competitive draw shift once a nearby anchor or competitor opens | Static drive-time maps built per deal |
| Drill-down exploration | Which corner, not just which market — parcel-level detail without switching tools | Separate GIS and spreadsheet tools |
| Standardized site scoring | How this site compares to every other candidate on one weighted matrix | Analyst-to-analyst variance in underwriting criteria |
None of this replaced human judgment — a regional real estate lead still makes the final call and still walks the site. What changed is what that judgment is underwritten on. Instead of reconciling five spreadsheets and a gut-check pro forma, the recommendation starts from a common, defensible trade-area score, and local market expertise gets layered on top of the model instead of substituting for it.
What Changed
The real shift wasn’t the platform — it was what the team stopped spending time on. Instead of manually compiling trade-area data and reconciling competitive intelligence market by market, analysts moved straight to comparative underwriting and expansion strategy. Site scoring became standardized across formats and geographies, whitespace and cannibalization signals became visible earlier in the pipeline, and site-approval decisions became something the real estate committee could defend on a common scoring model rather than a market-specific narrative.
That standardization also changed who could sit at the underwriting table. When trade-area math lived in scattered spreadsheets, only the analysts who built them could meaningfully interpret the model. With a shared scoring platform, real estate, finance, and category leadership can look at the same site score and the same cannibalization read — which shortens the distance between “this trade area looks like whitespace” and an approved, funded site.
Where Infocepts Fits
Infocepts builds retail site selection as a shared scoring model the whole real estate committee can defend — not a reporting layer analysts interpret alone.
- Rated #1 Data & Analytics provider on Gartner Peer Insights, three years running, with 97.2% client retention across 20+ years of delivery.
- A named store-execution portfolio — OptiStoreAI and Retail Connected Intelligence — so the same trade-area and performance data that scores a new site also runs the stores already open.
- Proven on retail real estate specifically, including measurable space-profitability gains from interactive geospatial analytics.
The Takeaway
Retail expansion looks like a real estate decision. It’s actually a data decision underwritten with real estate consequences. The retailers who scale their fleet well aren’t the ones with the sharpest local market instinct — they’re the ones who can underwrite trade-area opportunity consistently, at pipeline volume, against a shared scoring model and a clear-eyed view of cannibalization risk.
As rollout targets get more aggressive and formats multiply, spreadsheets and market-by-market feasibility studies simply run out of runway. Location intelligence — and a standardized site-scoring model built on it — is what replaces them.
Frequently Asked Questions
See What Smart Site Selection Looks Like For Your Pipeline
A standardized, portfolio-aware scoring model that surfaces whitespace, models cannibalization before capital commitment, and gives your real estate committee a common score to defend.

Author
The Infocepts Retail COE brings together data and analytics specialists focused on helping retail and CPG organizations turn complex data into smarter decisions. From demand forecasting and inventory optimization to customer analytics and omnichannel performance, the team works at the intersection of data engineering, AI, and retail strategy.
Read Full BioRecent Blogs



Infocepts
