


































































37%
Reduced time to insight
26%
Increased infrastructure preparedness
21%
Reduced mortality rate
11%
Increased treatment availability
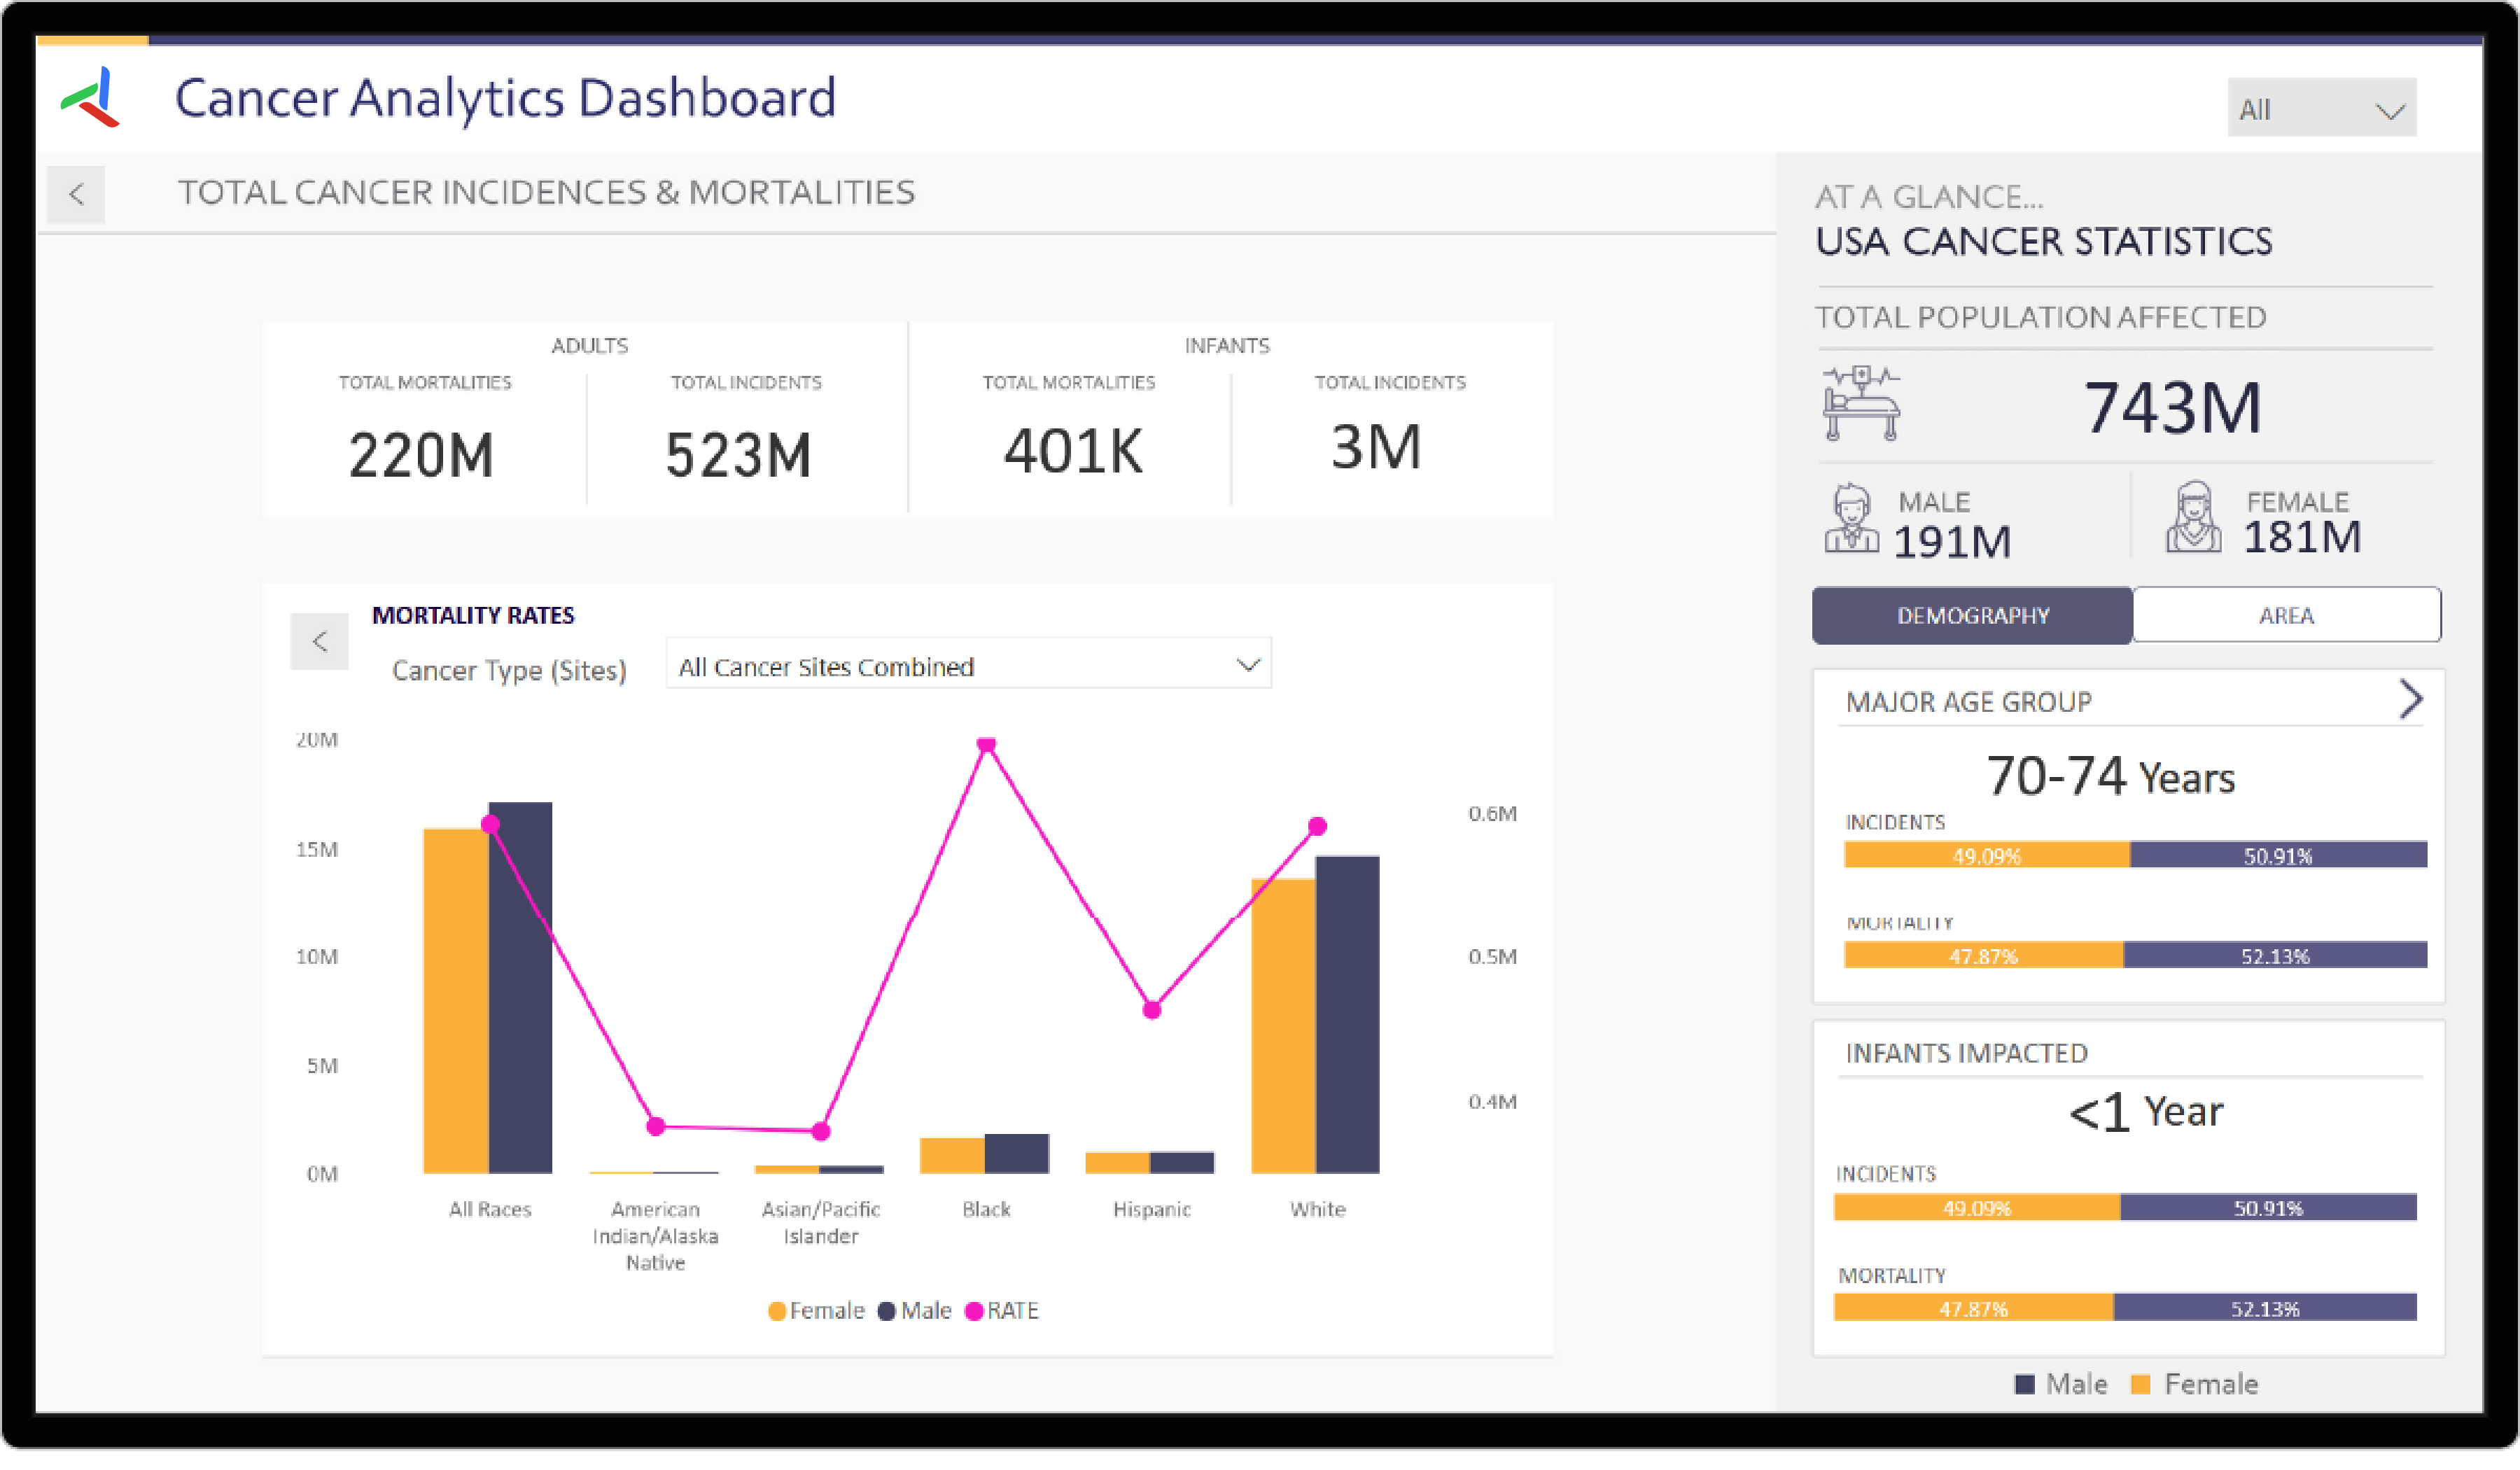
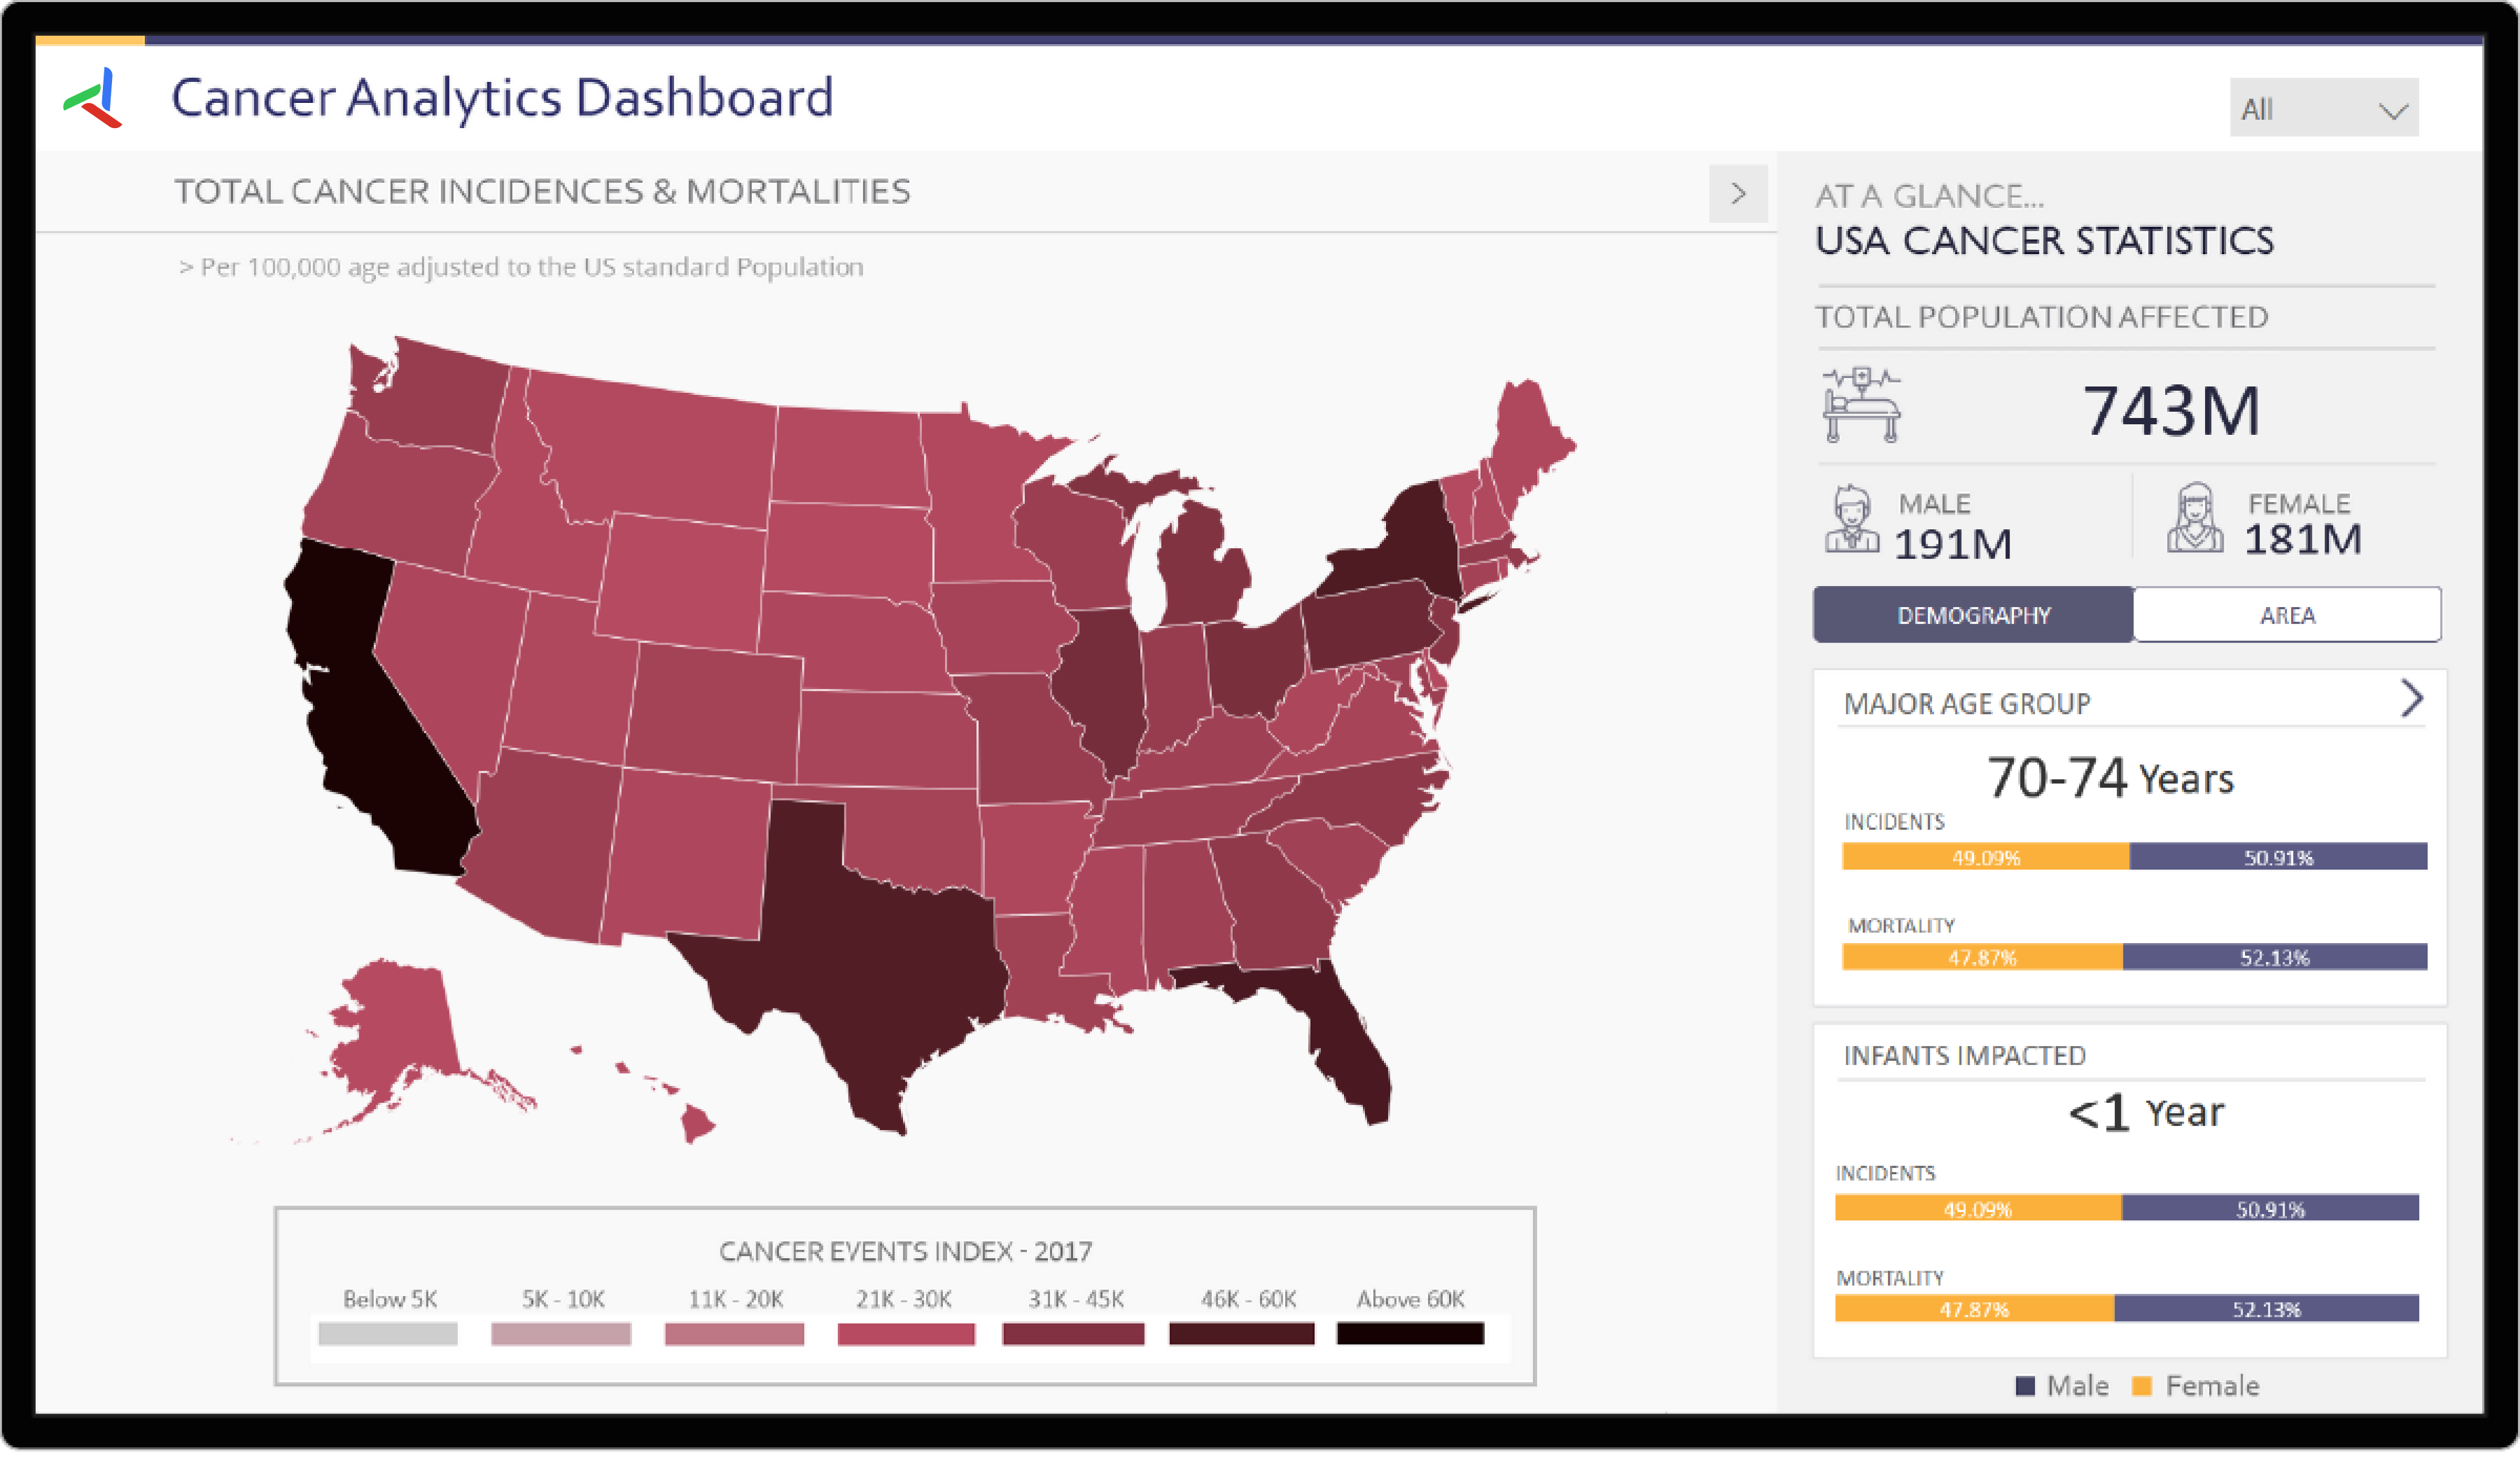
This oncology dashboard gives hospitals, caregivers, and pharmaceutical companies one real time view of cancer incidence, prevalence, and demographic trends. Planning teams use it to prepare treatment availability and infrastructure before demand arrives. Infocepts built it on Microsoft Power BI with predictive analytics and AI powered insights.
What problem did this dashboard by Infocepts solve for hospitals and pharmaceutical companies?
Hospitals, caregivers, and pharmaceutical companies need to prepare capacity ahead of demand, not react to it afterward. That takes a clear read on incidence, prevalence, and demographic trends. Infocepts built a dashboard that puts those trends in one place and adds predictive analytics through its artificial intelligence services.
What does the oncology dashboard track?
The dashboard tracks cancer incidence, prevalence, and demographic trends across the oncology landscape. A predictive layer flags likely increases in demand for specific treatments or regions. It works at the population and trend level. It aggregates data rather than showing individual patient charts, so the focus stays on planning and resource allocation.
Who uses oncology dashboards in healthcare and pharma organizations and how?
Hospitals and caregivers use the trends to plan treatment availability and infrastructure before demand rises. Pharmaceutical companies use the same view to allocate resources across regions. Planning leaders get a shared picture in real time, so conversations about capacity start from the same numbers instead of separate reports.
What business impact did the hospitals and pharmaceutical companies see after rollout?
Reported results include a 37% reduction in time to insight, 26% higher infrastructure preparedness, and 11% higher treatment availability. Those figures point to faster planning and better capacity readiness. They describe operations and resource planning.
Key metrics: cancer incidence, prevalence, demographic trends, time to insight, infrastructure preparedness, and treatment availability.
Explore more examples in the Life Sciences section, see the cancer prevalence insights dashboard, or read our case studies.
Want an oncology dashboard for your organization? Talk to our team about what to track and how to build it.

 Pranali Lanjewar



