93x
Reduced time to customer insights
37%
Increased efficacy of marketing campaigns
28%
Increased customer retention rate
24
Manhours saved /week
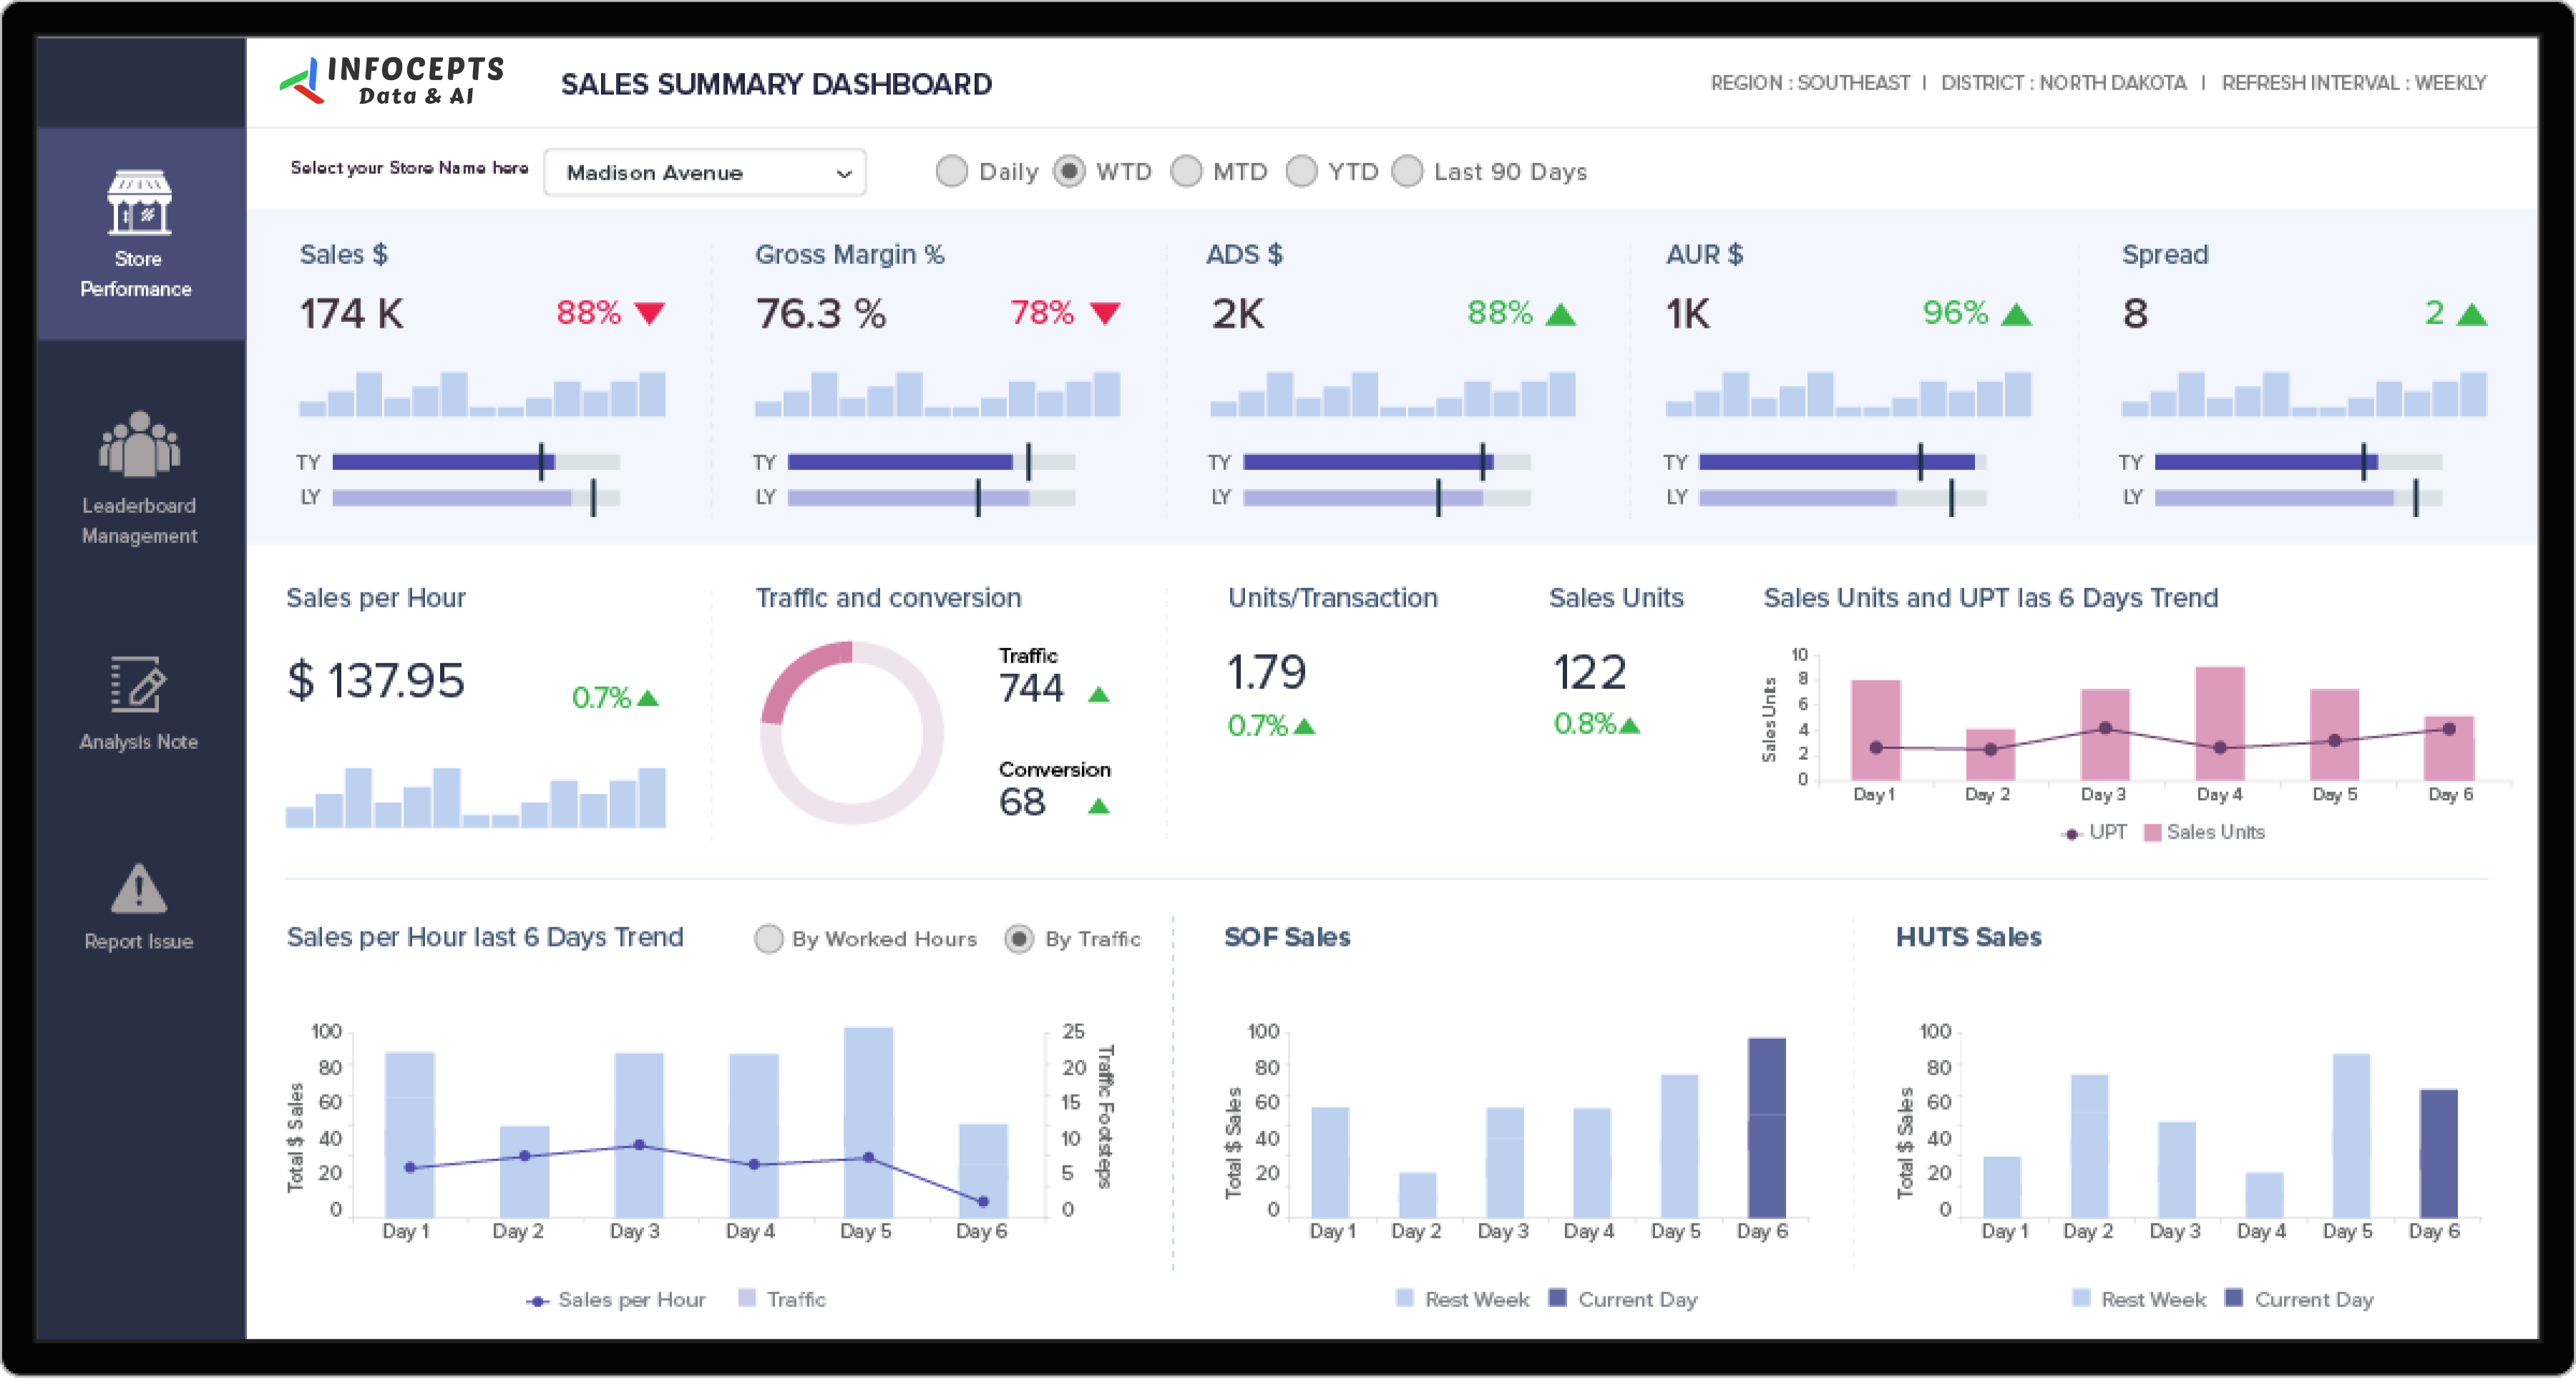
The Shopping Trends dashboard applies retail foot traffic analytics to CCTV footage and transaction logs. It gives a real time view of customer movement, preferences, and purchasing patterns. Marketers and store leaders use it to tune campaigns and store performance. Infocepts built it on MicroStrategy.
The dashboard tracks customer footfall, conversion rates, and dwell times. Turning raw video and transaction data into usable views is a job for data engineering and integration.
More retail examples sit in the Retail & CPG section, including store performance analytics.
Want to see how shoppers move through your stores? Talk to our team.
Frequently asked questions
It converts raw sources like CCTV footage and transaction logs into footfall, dwell time, and conversion metrics, so retailers see in store shopping behavior the same way they already see online behavior.
Seeing where customers spend time and where they convert lets retailers adjust layout, staffing, or promotions at the specific store or section driving the gap.
How long customers linger in a section, which often signals interest even when it does not convert immediately, useful for merchandising and staffing decisions.
Yes. Shopping pattern and preference data drives more targeted campaigns than a generic offer sent to every customer.
Retail marketers and store operations teams responsible for in store engagement, layout, and campaign performance.
By turning footfall and transaction data into a BI view through Business Analytics services, for Retail & CPG organizations.

 Pranali Lanjewar