46%
Reduced time to insight
62%
Reduced maintenance and cost efforts
32%
Precision in comparative analysis
33%
Enhanced operational efficiency
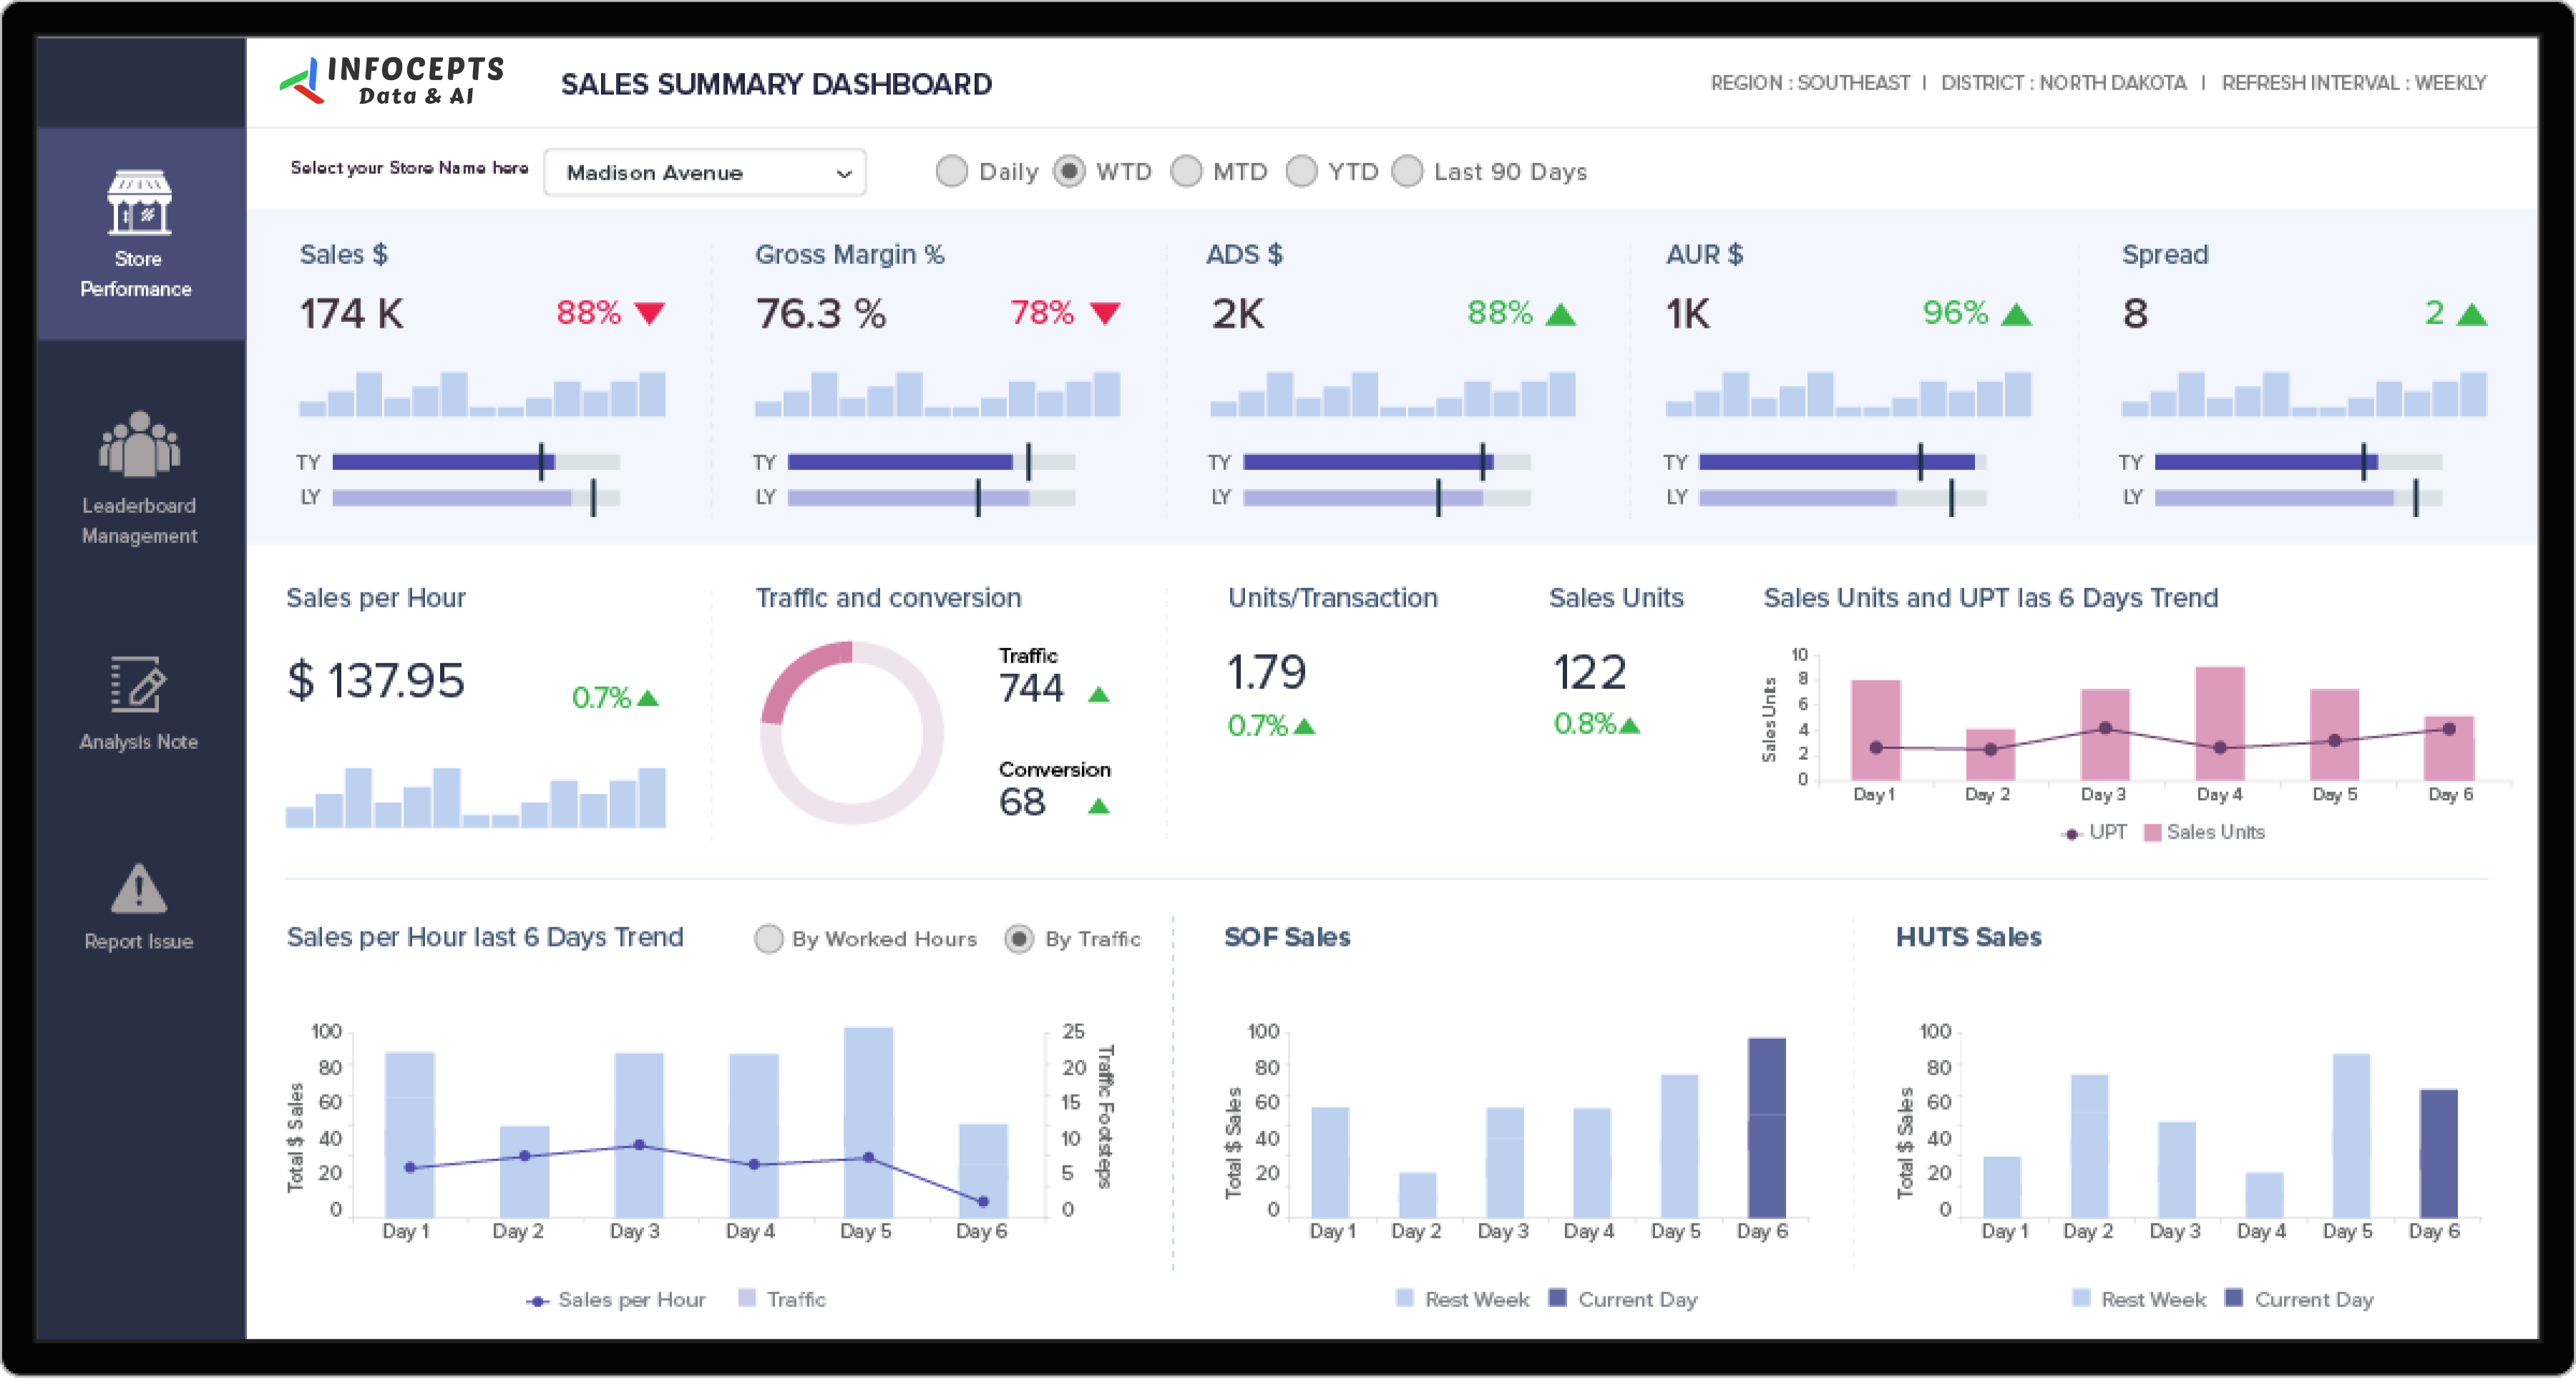
This retail KPI dashboard gives retailers and franchise owners a real time view of sales by store, brand, and time period. Teams use it to find growth opportunities, plan inventory, and sharpen forecasts. Infocepts built it on MicroStrategy as the Retail Business Unit Sales Dashboard.
Infocepts built the views through data product design, so store level and brand level sales are easy to compare.
Explore more in the Retail & CPG section, including store performance analytics and product sales and profitability insights.
Want a retail KPI dashboard for your business? Talk to our team about what to track and how to build it.
Frequently asked questions
It brings sales performance, brand wise contribution, and time based trends across business units into one view, so retailers see store level and brand level results together rather than in separate reports.
Time based sales trends by business unit give a more reliable forecasting baseline than a single company wide sales number, since different brands or units often move differently.
Leading retailers and franchise owners who need a holistic view across multiple stores and brands rather than reviewing each location individually.
Connecting sales trend data to specific stores and brands shows where inventory should be prioritized based on actual demand, not an average across the whole chain.
How much of total sales each brand or business unit is responsible for, which helps prioritize where growth investment will have the most impact.
By connecting POS and sales data into a BI platform through Business Analytics services, for Retail & CPG organizations.

 Pranali Lanjewar