


































































58%
Increase in Patient Engagement Scores
76%
Improvement in Sentiment Analysis Accuracy
63%
Growth in Decision-Making Efficiency
49%
Rise in Patient Retention Rates
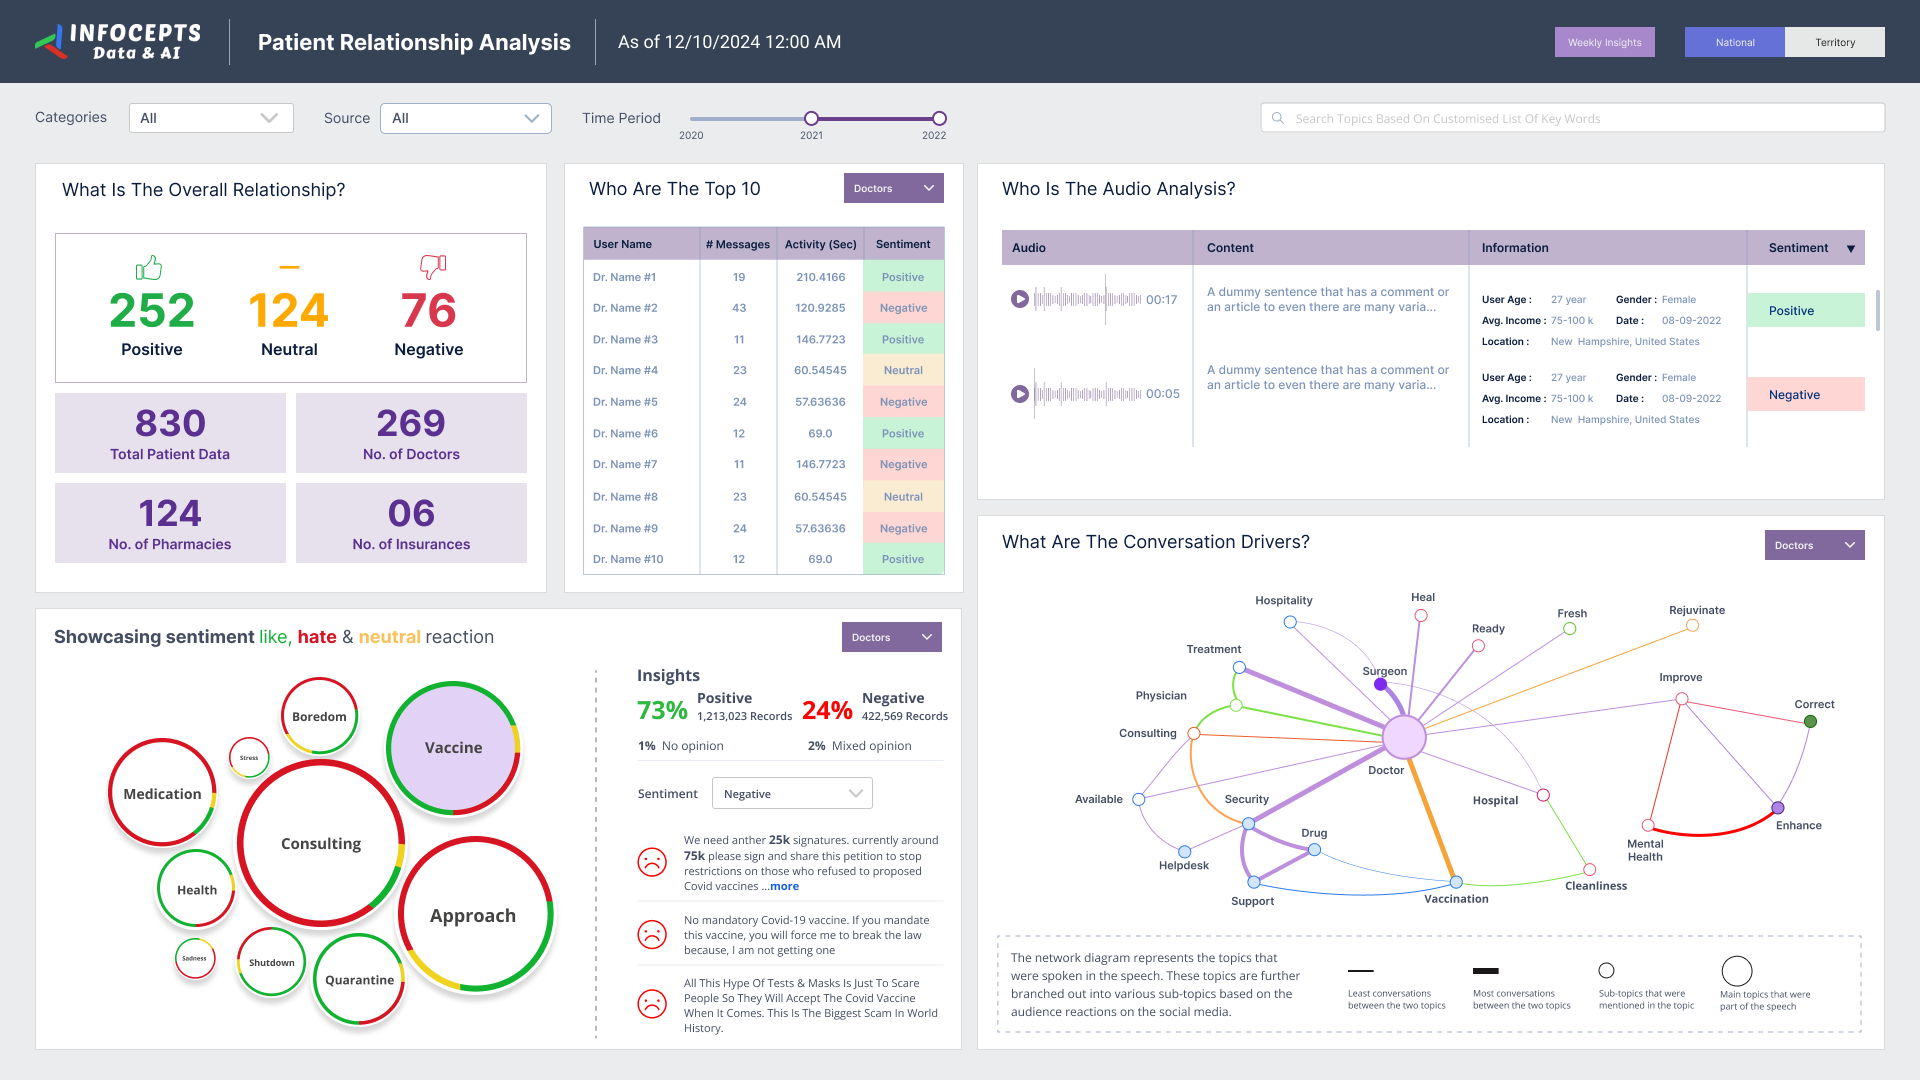
This patient engagement analytics dashboard helps healthcare providers and patient experience teams see how patients interact with care. It uses sentiment analysis to assess behaviors and emotional cues, and it writes automated narratives that explain what changed. Teams use it to refine engagement strategy. Infocepts built it on Power BI.
What problem did this dashboard by Infocepts solve for the patient experience team?
A periodic satisfaction survey shows engagement problems late, and reading every patient note is not practical. Infocepts built a dashboard that applies sentiment analysis to patient communications and interactions. The language capability comes from its artificial intelligence work, so teams can act on trends instead of individual notes.
What does the patient engagement dashboard track?
It tracks patient engagement scores, sentiment, and behavior signals across a patient population. Automated narrative generation writes a plain language summary of what the data shows, so staff do not have to interpret raw charts. Visualizations highlight trends and show opportunities to improve patient interactions.
Who uses patient engagement dashboards in healthcare organizations and how?
Healthcare providers use them to refine engagement strategy across a patient population. Patient experience teams watch sentiment trends and decide where to follow up. Clinical and admin staff read the automated narratives to see what changed. The dashboard works as an engagement and experience layer and does not replace clinical systems.
What business impact did the patient experience team see after rollout?
Reported results include a 58% increase in patient engagement scores and a 49% rise in patient retention rates. It also lists a 63% growth in decision making efficiency and a 76% improvement in sentiment analysis accuracy.
Key metrics: patient engagement scores, sentiment analysis accuracy, patient retention rates, and decision making efficiency.
Explore more examples in the Life Sciences section, see the medication adherence analytics dashboard, or review the healthcare performance analytics dashboard.
Want a patient engagement dashboard for your organization? Talk to our team about what to track and how to build it.

 Pranali Lanjewar



