73%
Reduced time to retrieve records
23%
Reduced maintenance cost
17%
Decrease in low-performing courses
41%
Reduced time in closing of transfer application
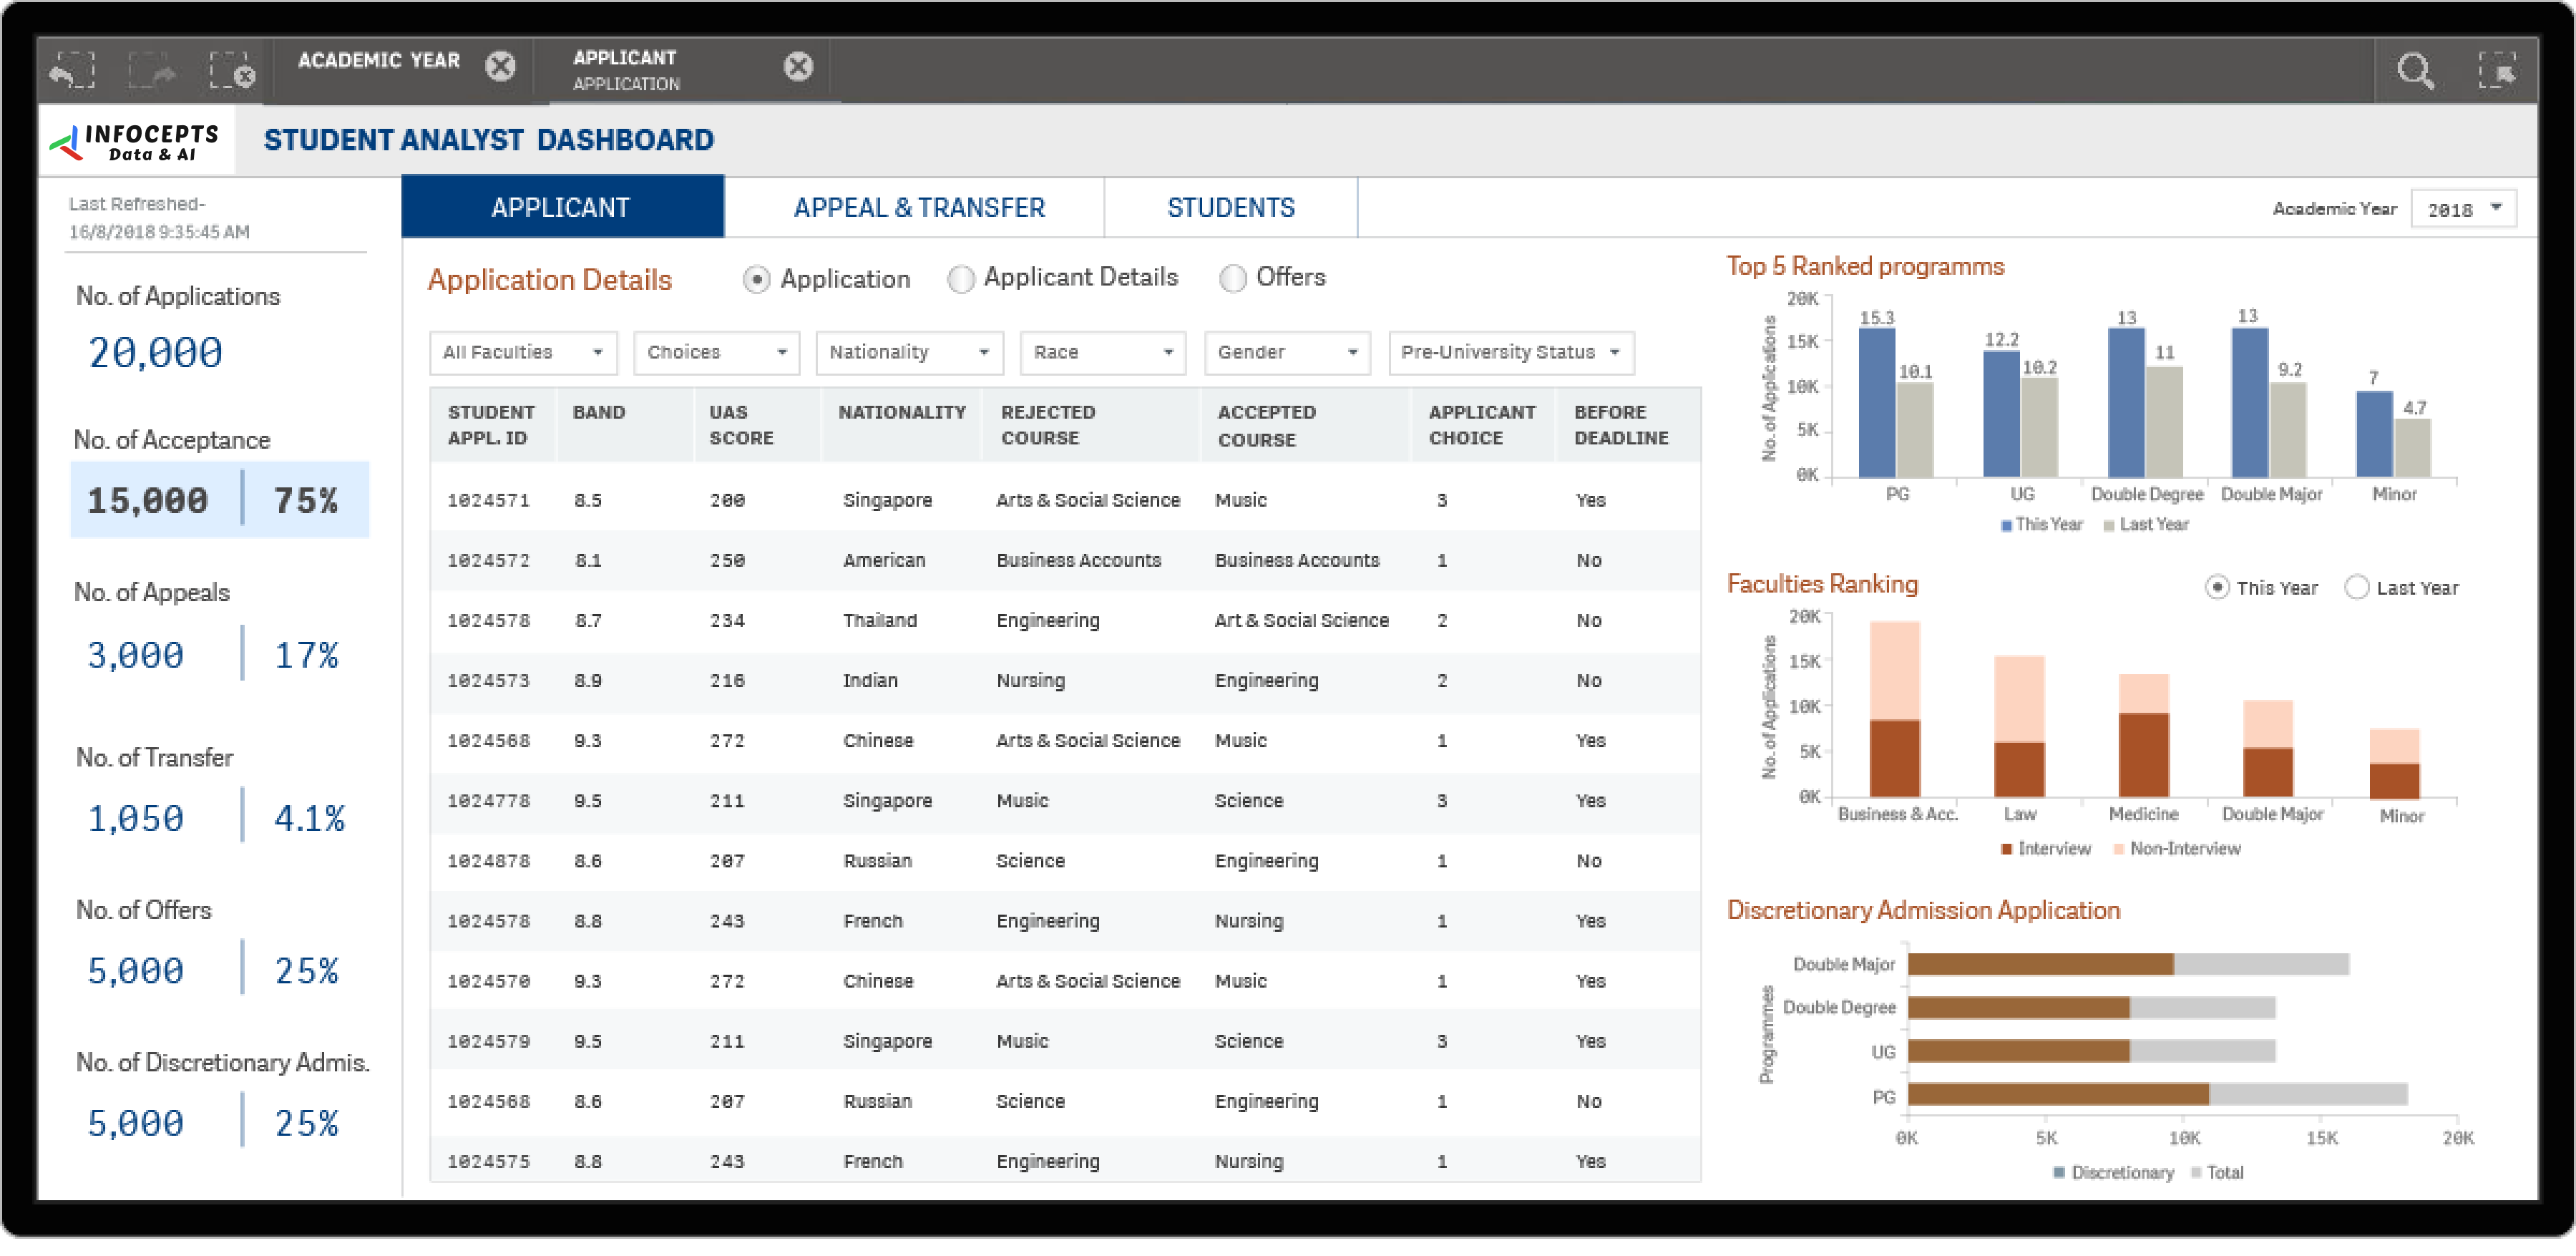
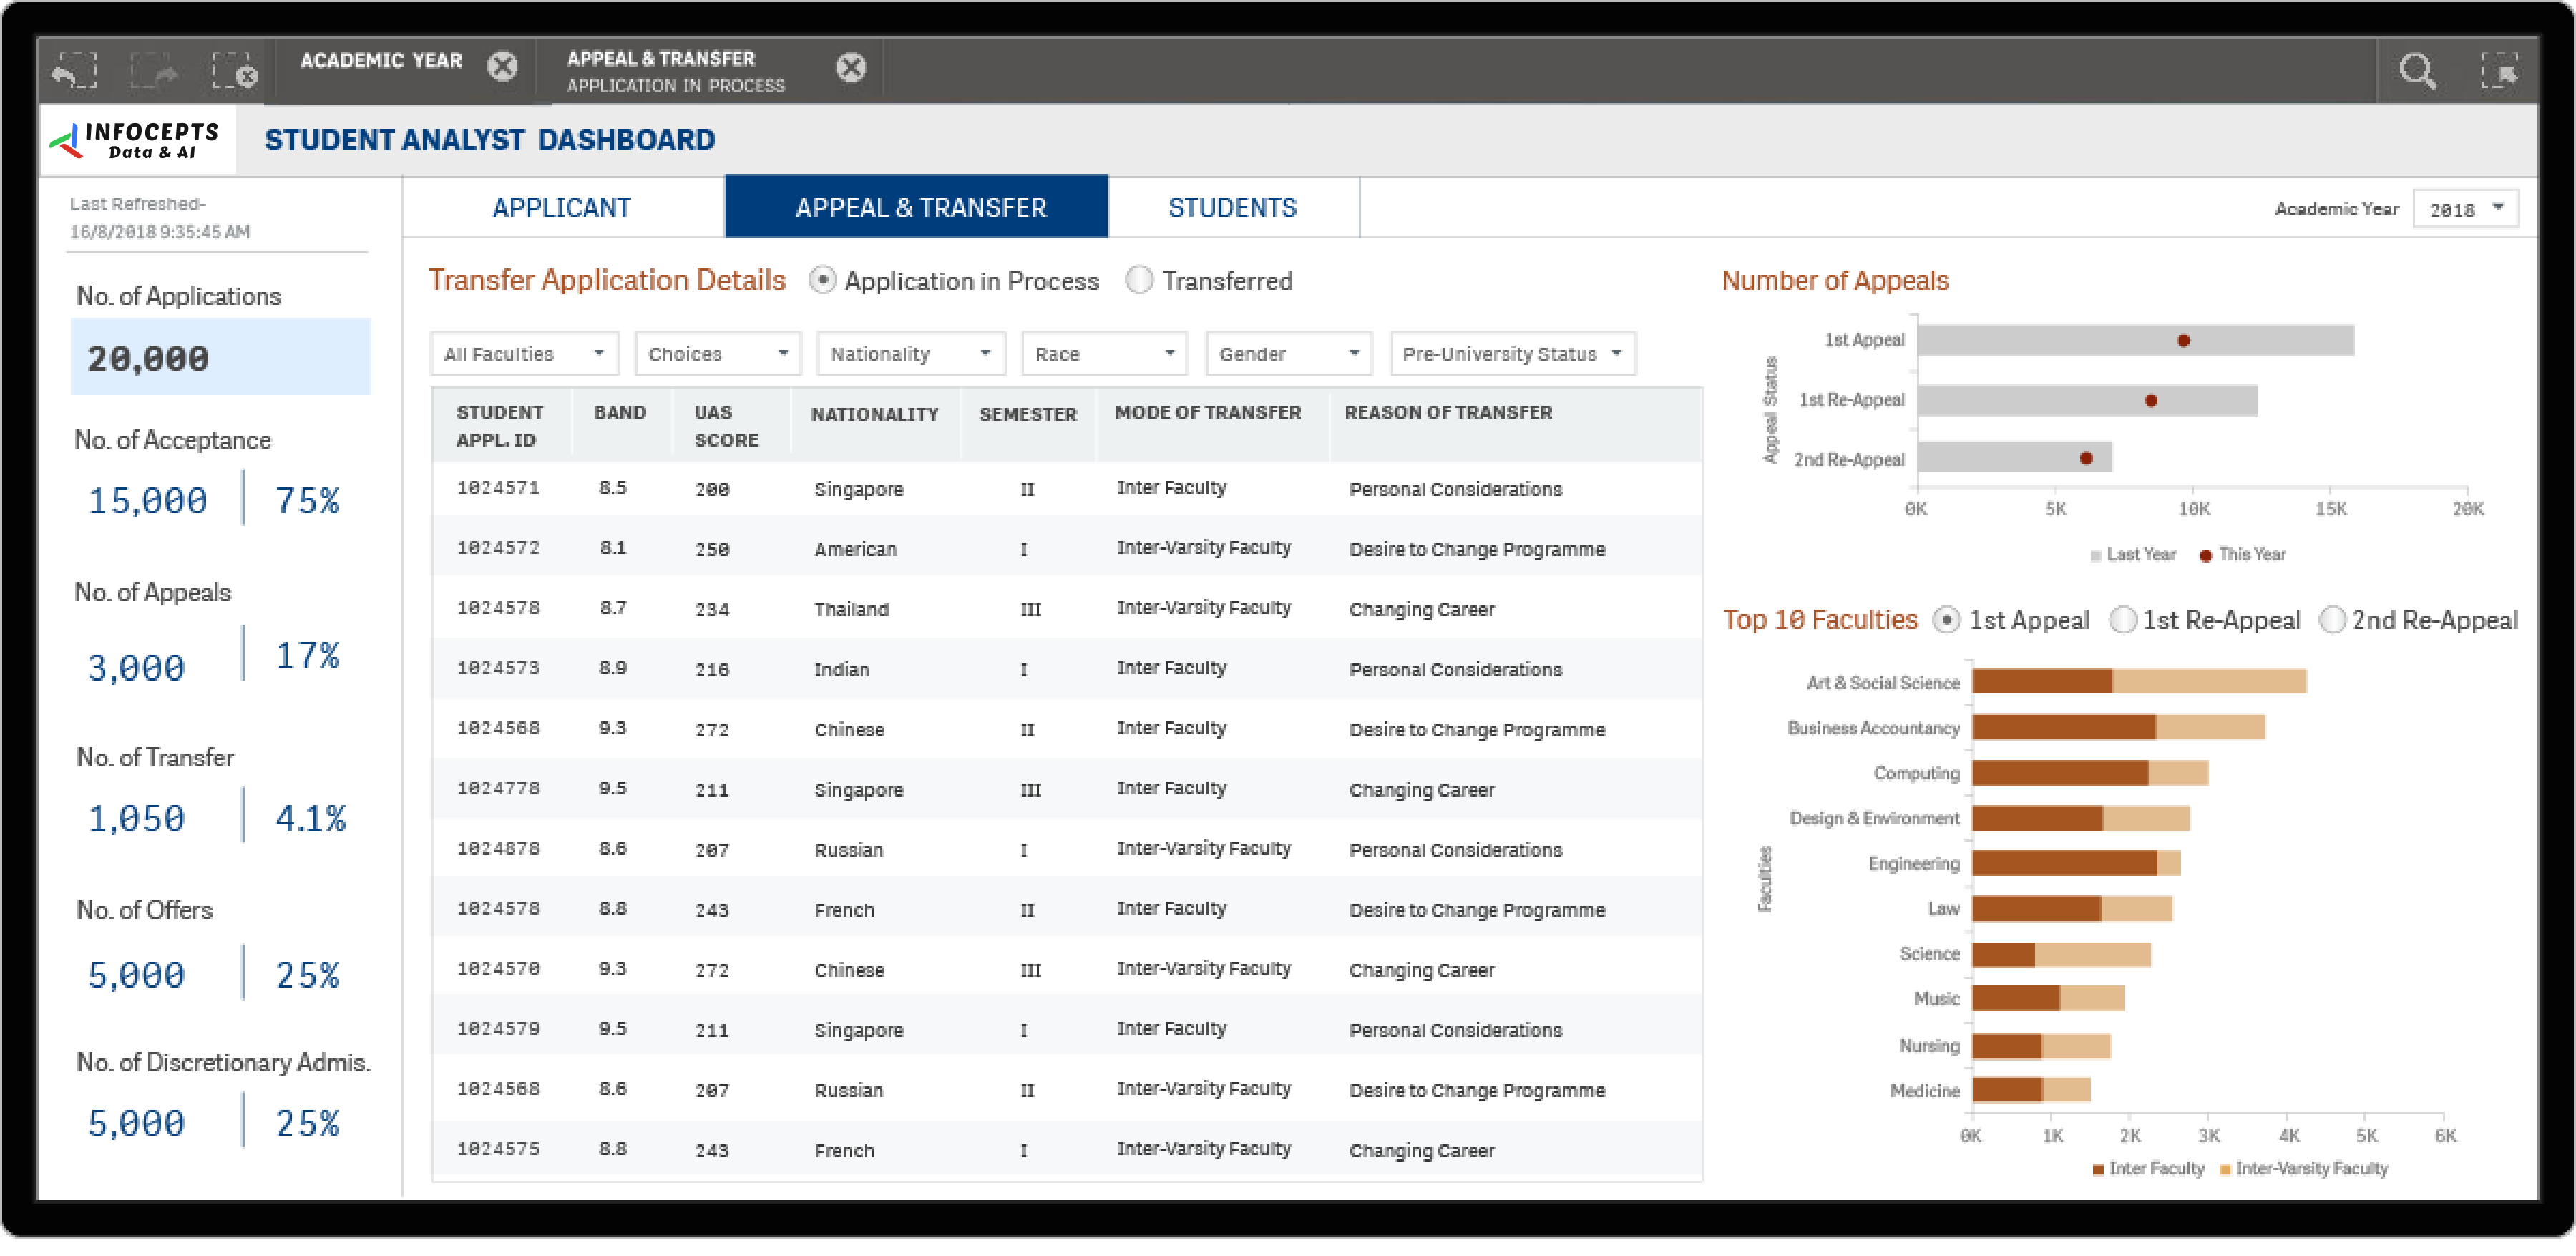
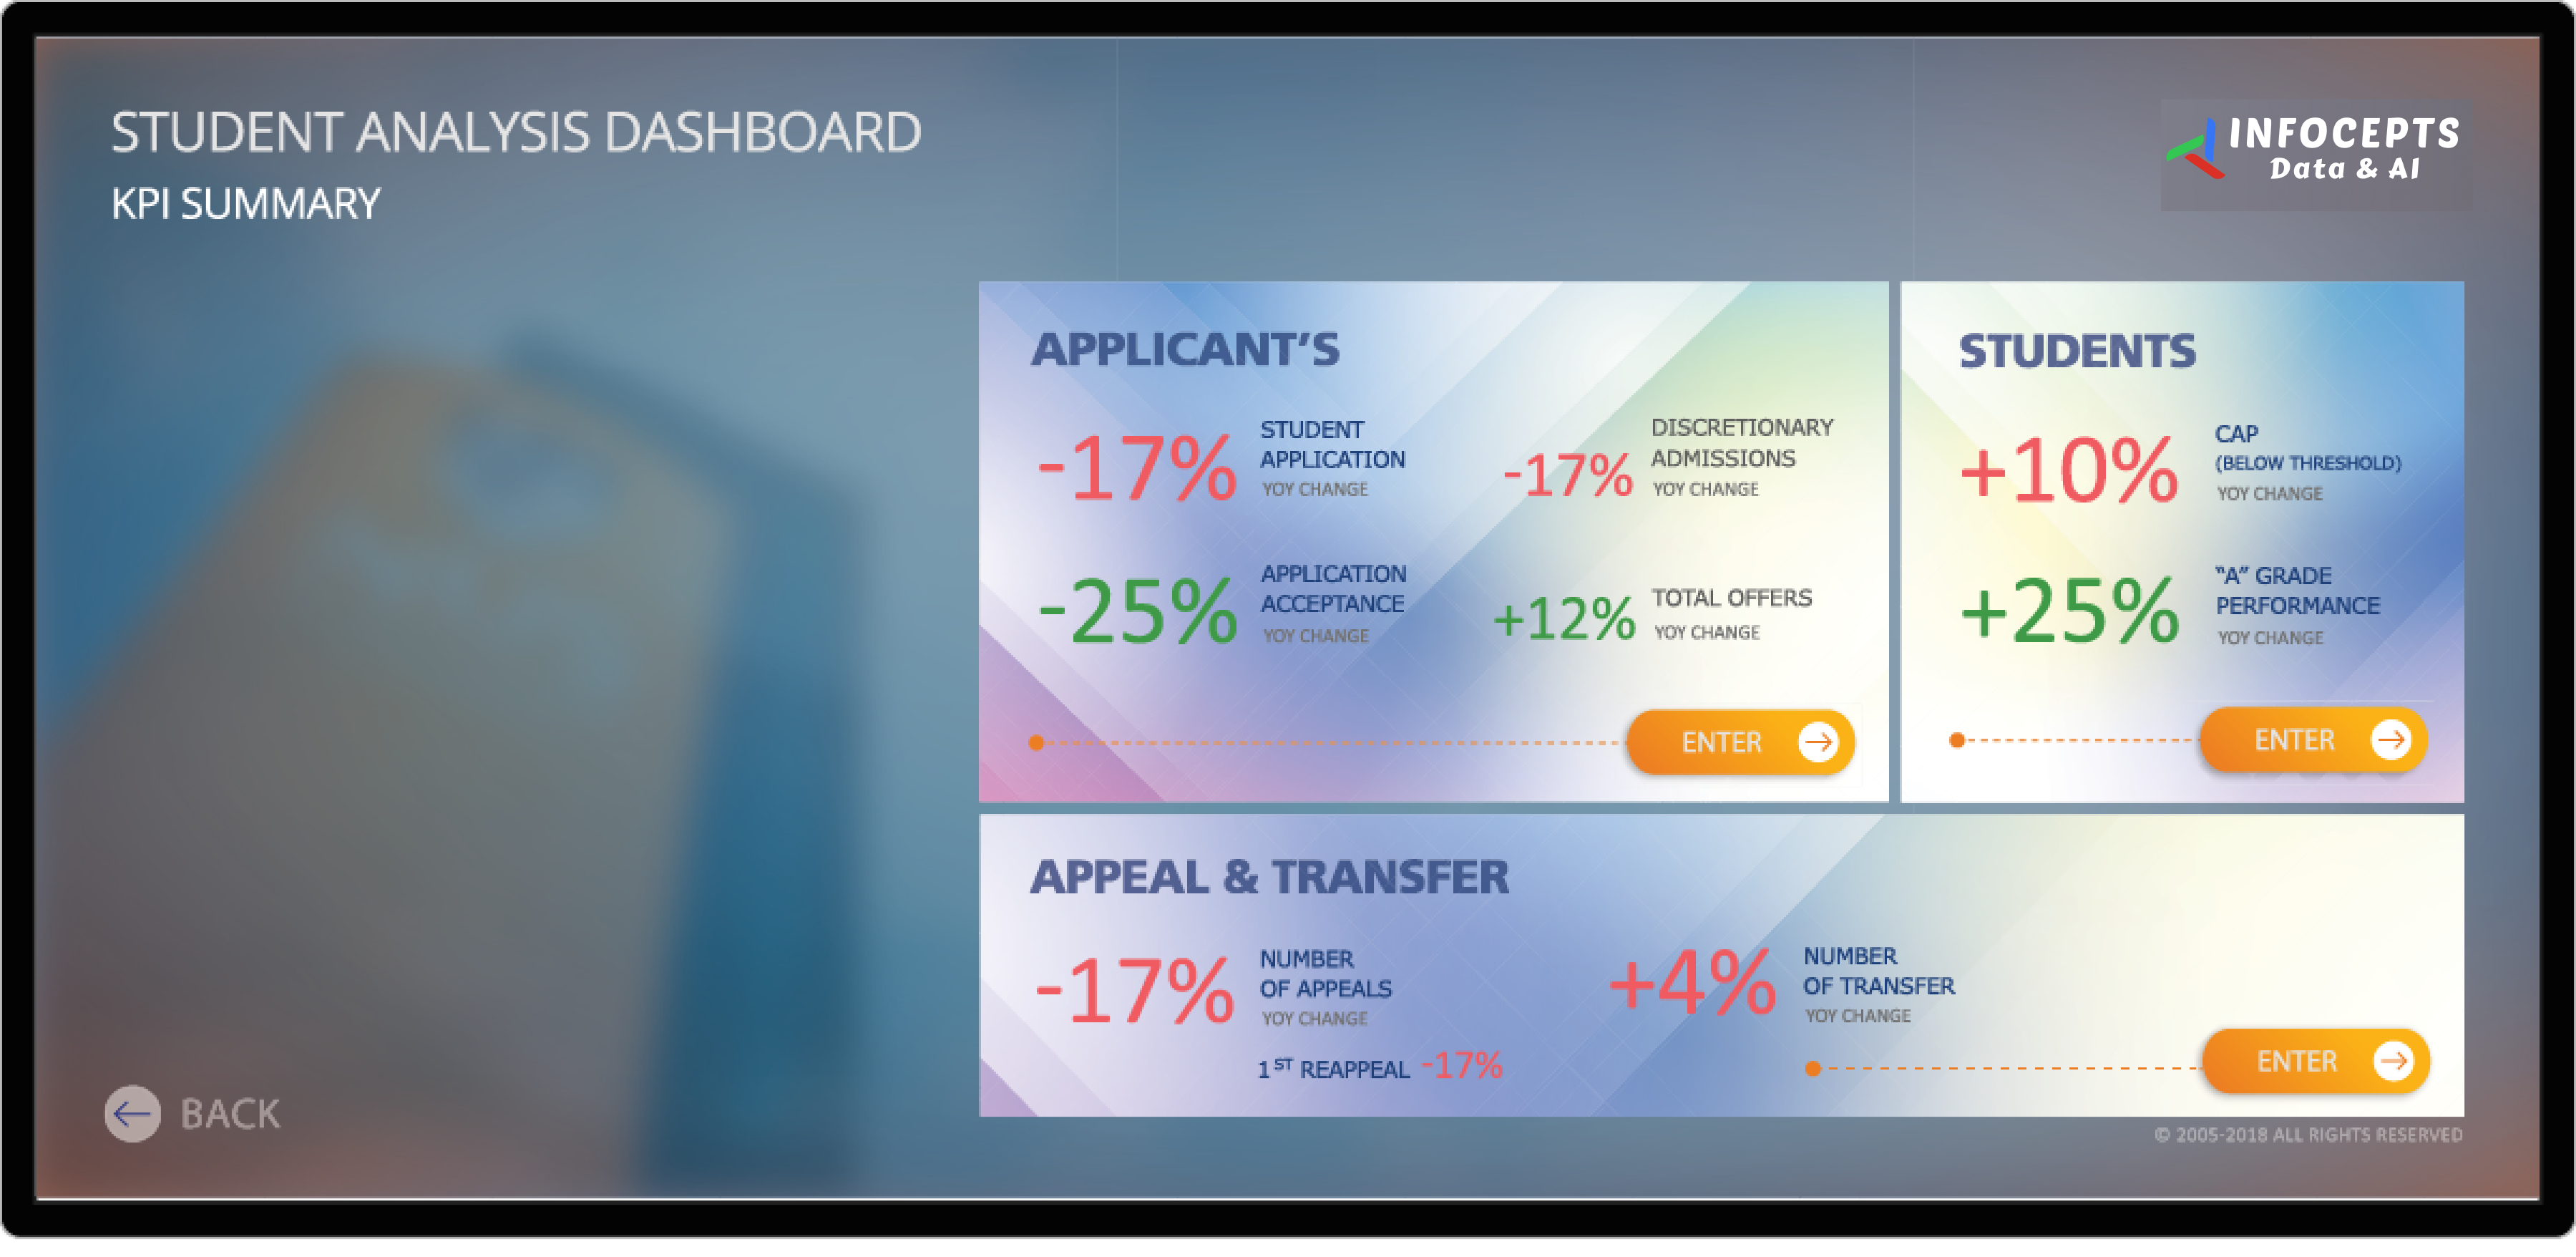
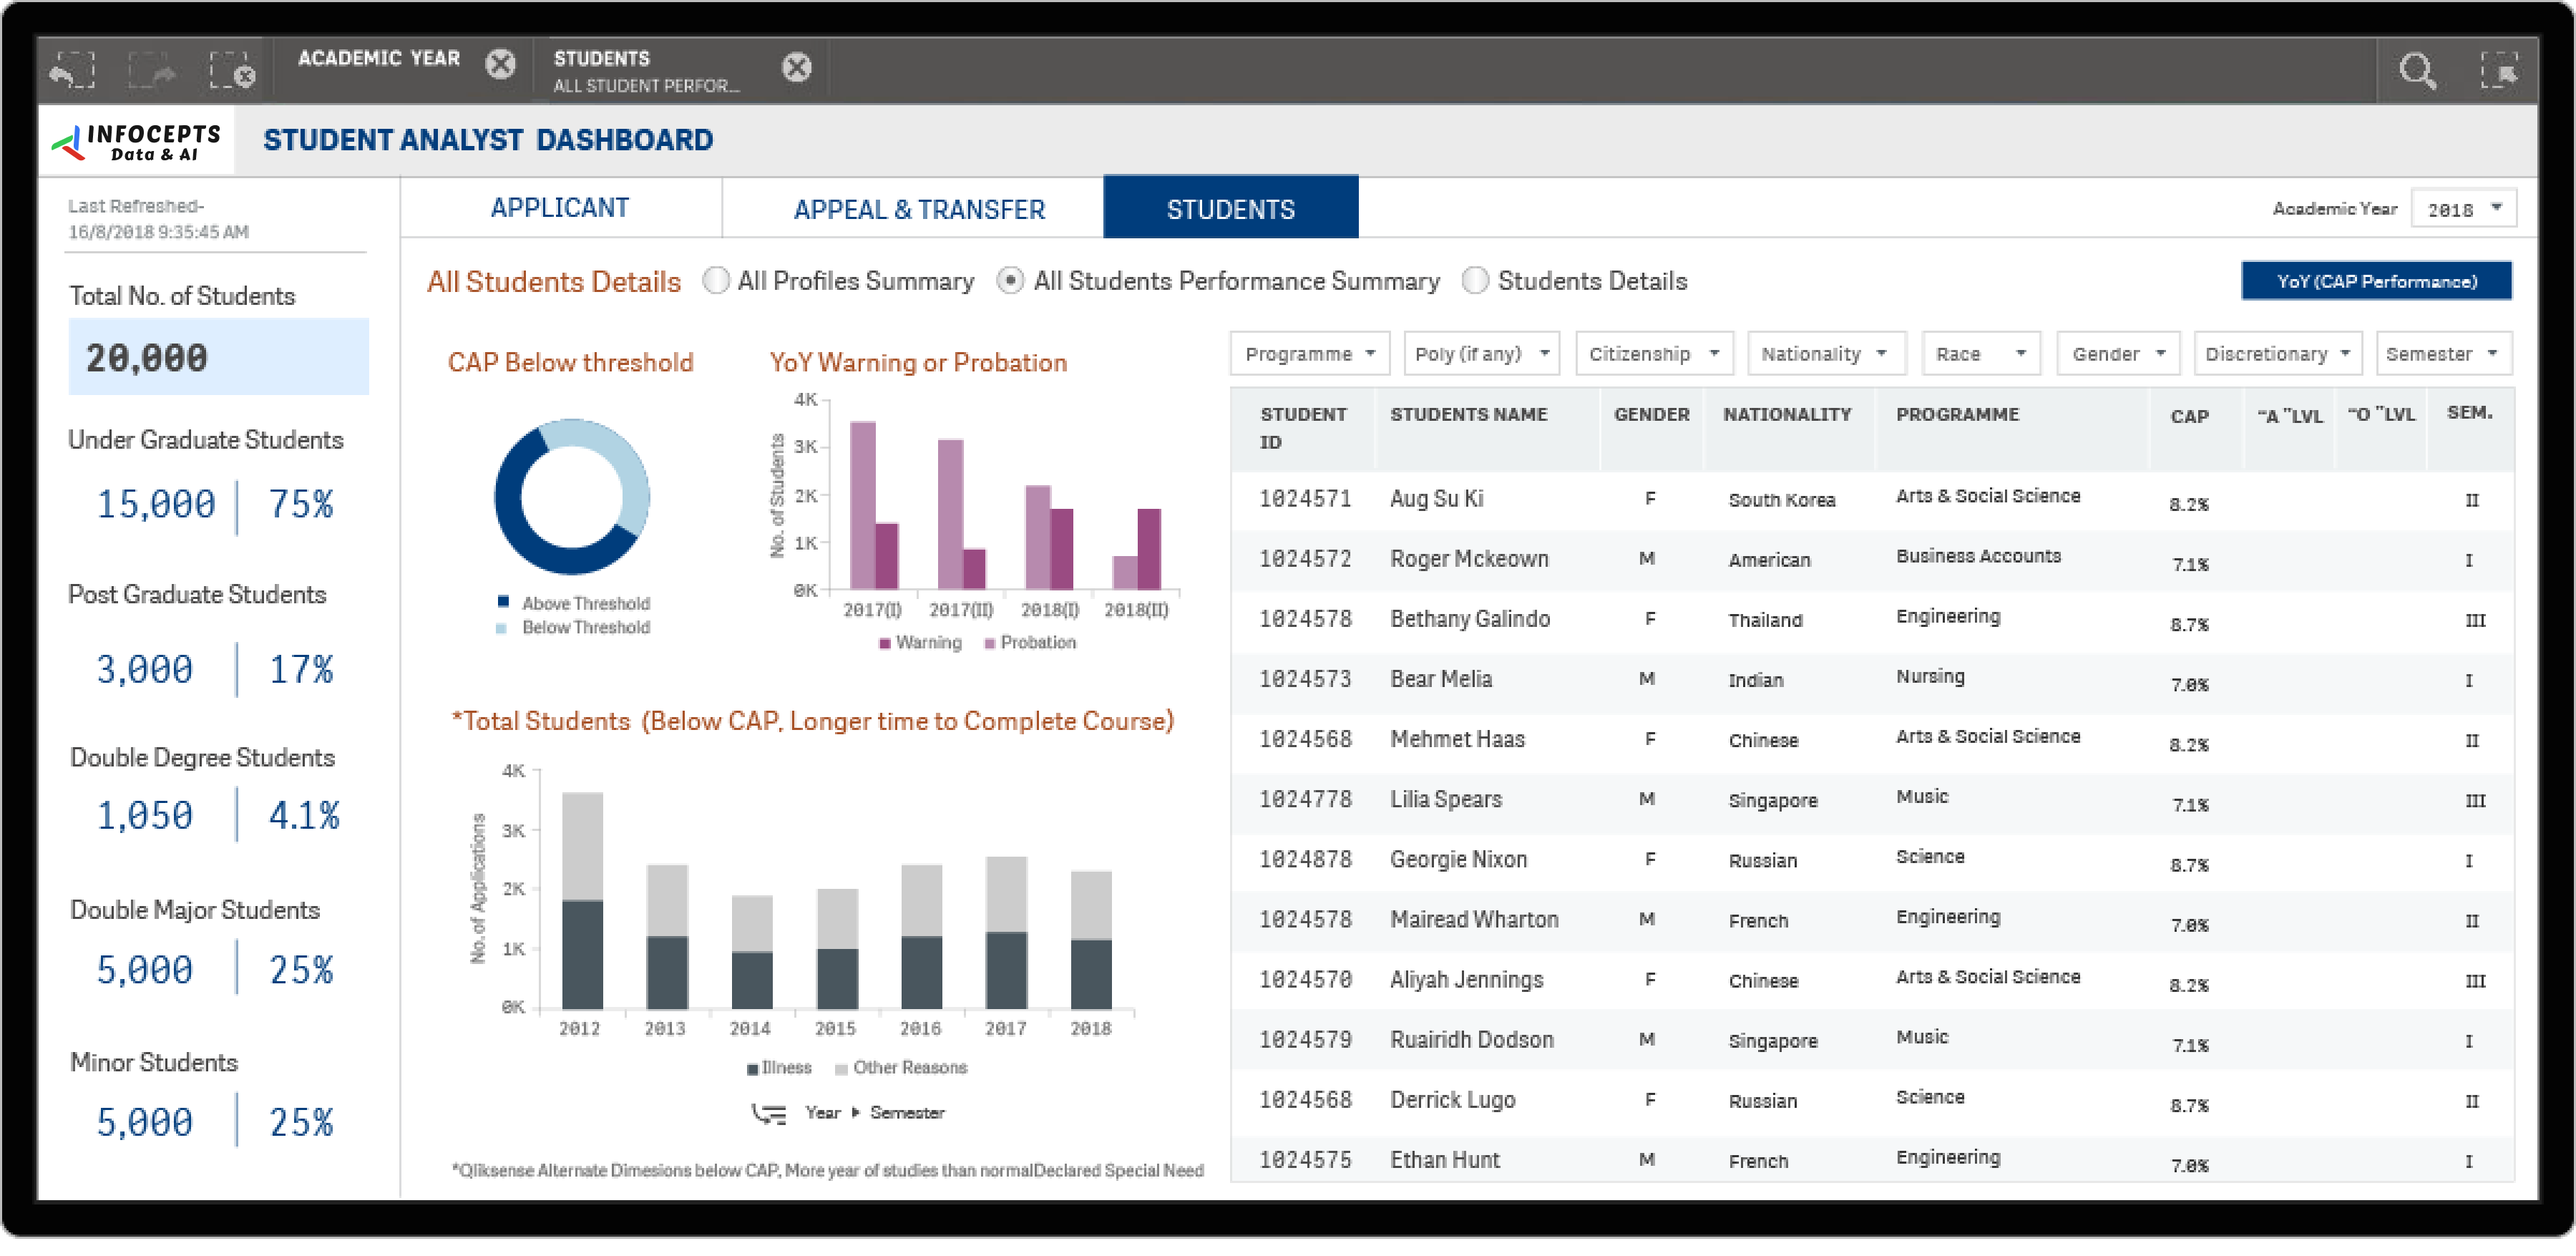
The student application dashboard gives universities and educational institutions one view of student applications, academic performance, and professional development. It consolidates student data from various sources so staff can analyze trends, track performance, and make decisions quickly. Infocepts built it on Qlik.
Bringing the sources together is data engineering and integration work.
For a related example, see the learning performance analytics dashboard for educational institutes, or read our case studies.
Planning a student analytics dashboard for your institution? Talk to our team about what to track and how to build it.
Frequently asked questions
It consolidates student data from multiple sources into one view, covering applications, academic performance, and professional development, so university staff are not piecing insight together from separate systems.
Seeing application trends as they develop, rather than after a cycle closes, lets admissions teams adjust outreach or capacity planning while it still matters.
A connection between how students were admitted and how they perform academically, which helps refine admissions criteria over time.
University and institutional staff responsible for admissions, academic performance tracking, and student success initiatives.
Yes. Professional development data is included alongside academic and application data, giving a fuller picture of student outcomes beyond the classroom.
By connecting student information systems into a BI platform through Business Analytics services.

 Pranali Lanjewar