58%
Faster Inventory Turnover
58%
Reduction in Stockout Losses
28%
Growth in New Customers
33%
Faster Inventory Sell-Through
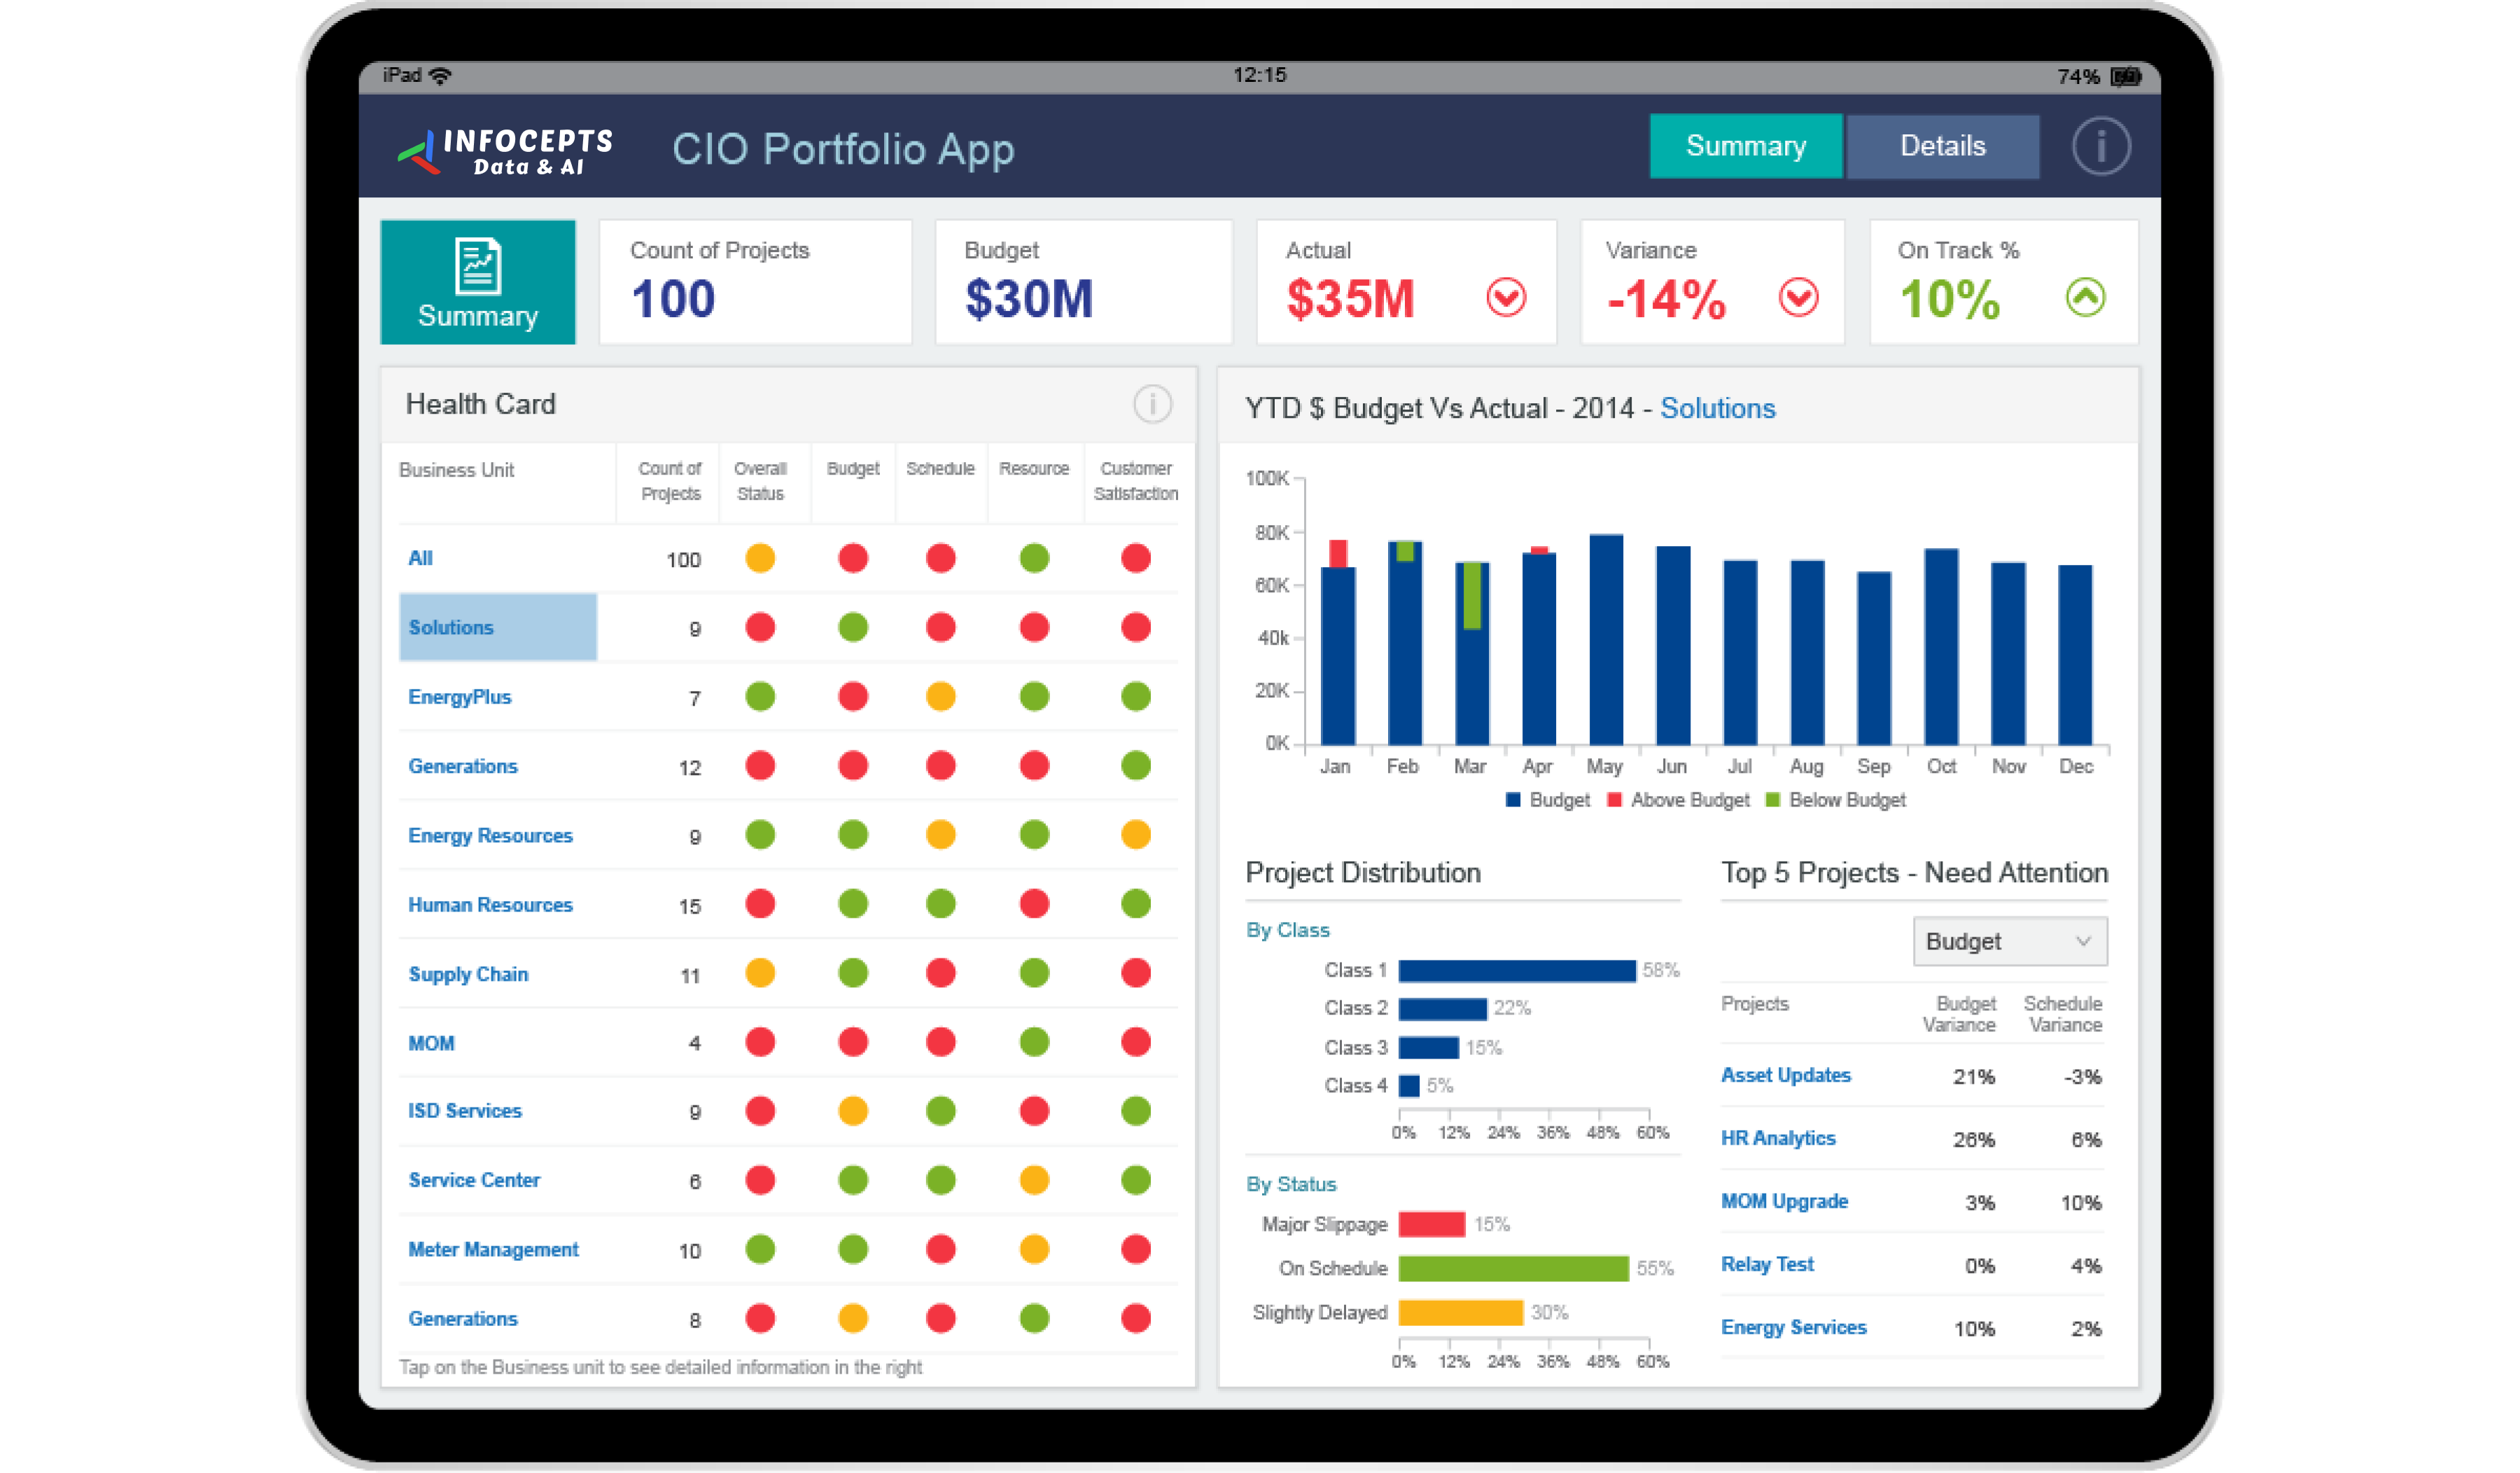
This inventory optimization dashboard gives procurement teams, supply chain managers, and business executives one view of inventory. They use it to control costs, improve service levels, speed up turnover, and prevent stockouts. Infocepts built it on MicroStrategy, bringing business intelligence and data analytics together to support supplier collaboration.
Infocepts delivered it through business analytics services, using data storytelling and design thinking.
For more from Retail & CPG, see inventory analytics for retail and retail planning analytics.
To build an inventory optimization dashboard for your own supply chain, talk to our team.
Frequently asked questions
It gives procurement teams, supply chain managers, and executives one view into stock cost, service levels, and turnover, so decisions about the right stock at the right time are based on current data, not periodic counts.
Tracking turnover and service levels together surfaces where stock is running thin before a shelf actually empties, giving procurement time to reorder.
Balancing inventory turnover against holding cost and service level targets simultaneously, which is difficult to do manually across a large SKU catalog.
Sharing consistent inventory and demand data with suppliers reduces the back and forth of reconciling numbers before a replenishment decision.
Procurement teams, supply chain managers, and business executives responsible for inventory cost and service level tradeoffs.
By connecting procurement and inventory systems into a BI platform through Business Analytics services, for Retail & CPG organizations.

 Pranali Lanjewar