


































































72%
Increased dashboard usage as a central system
33%
Reduced response time during flight delays
89%
Decrease in errors
22%
Increased savings in operational time
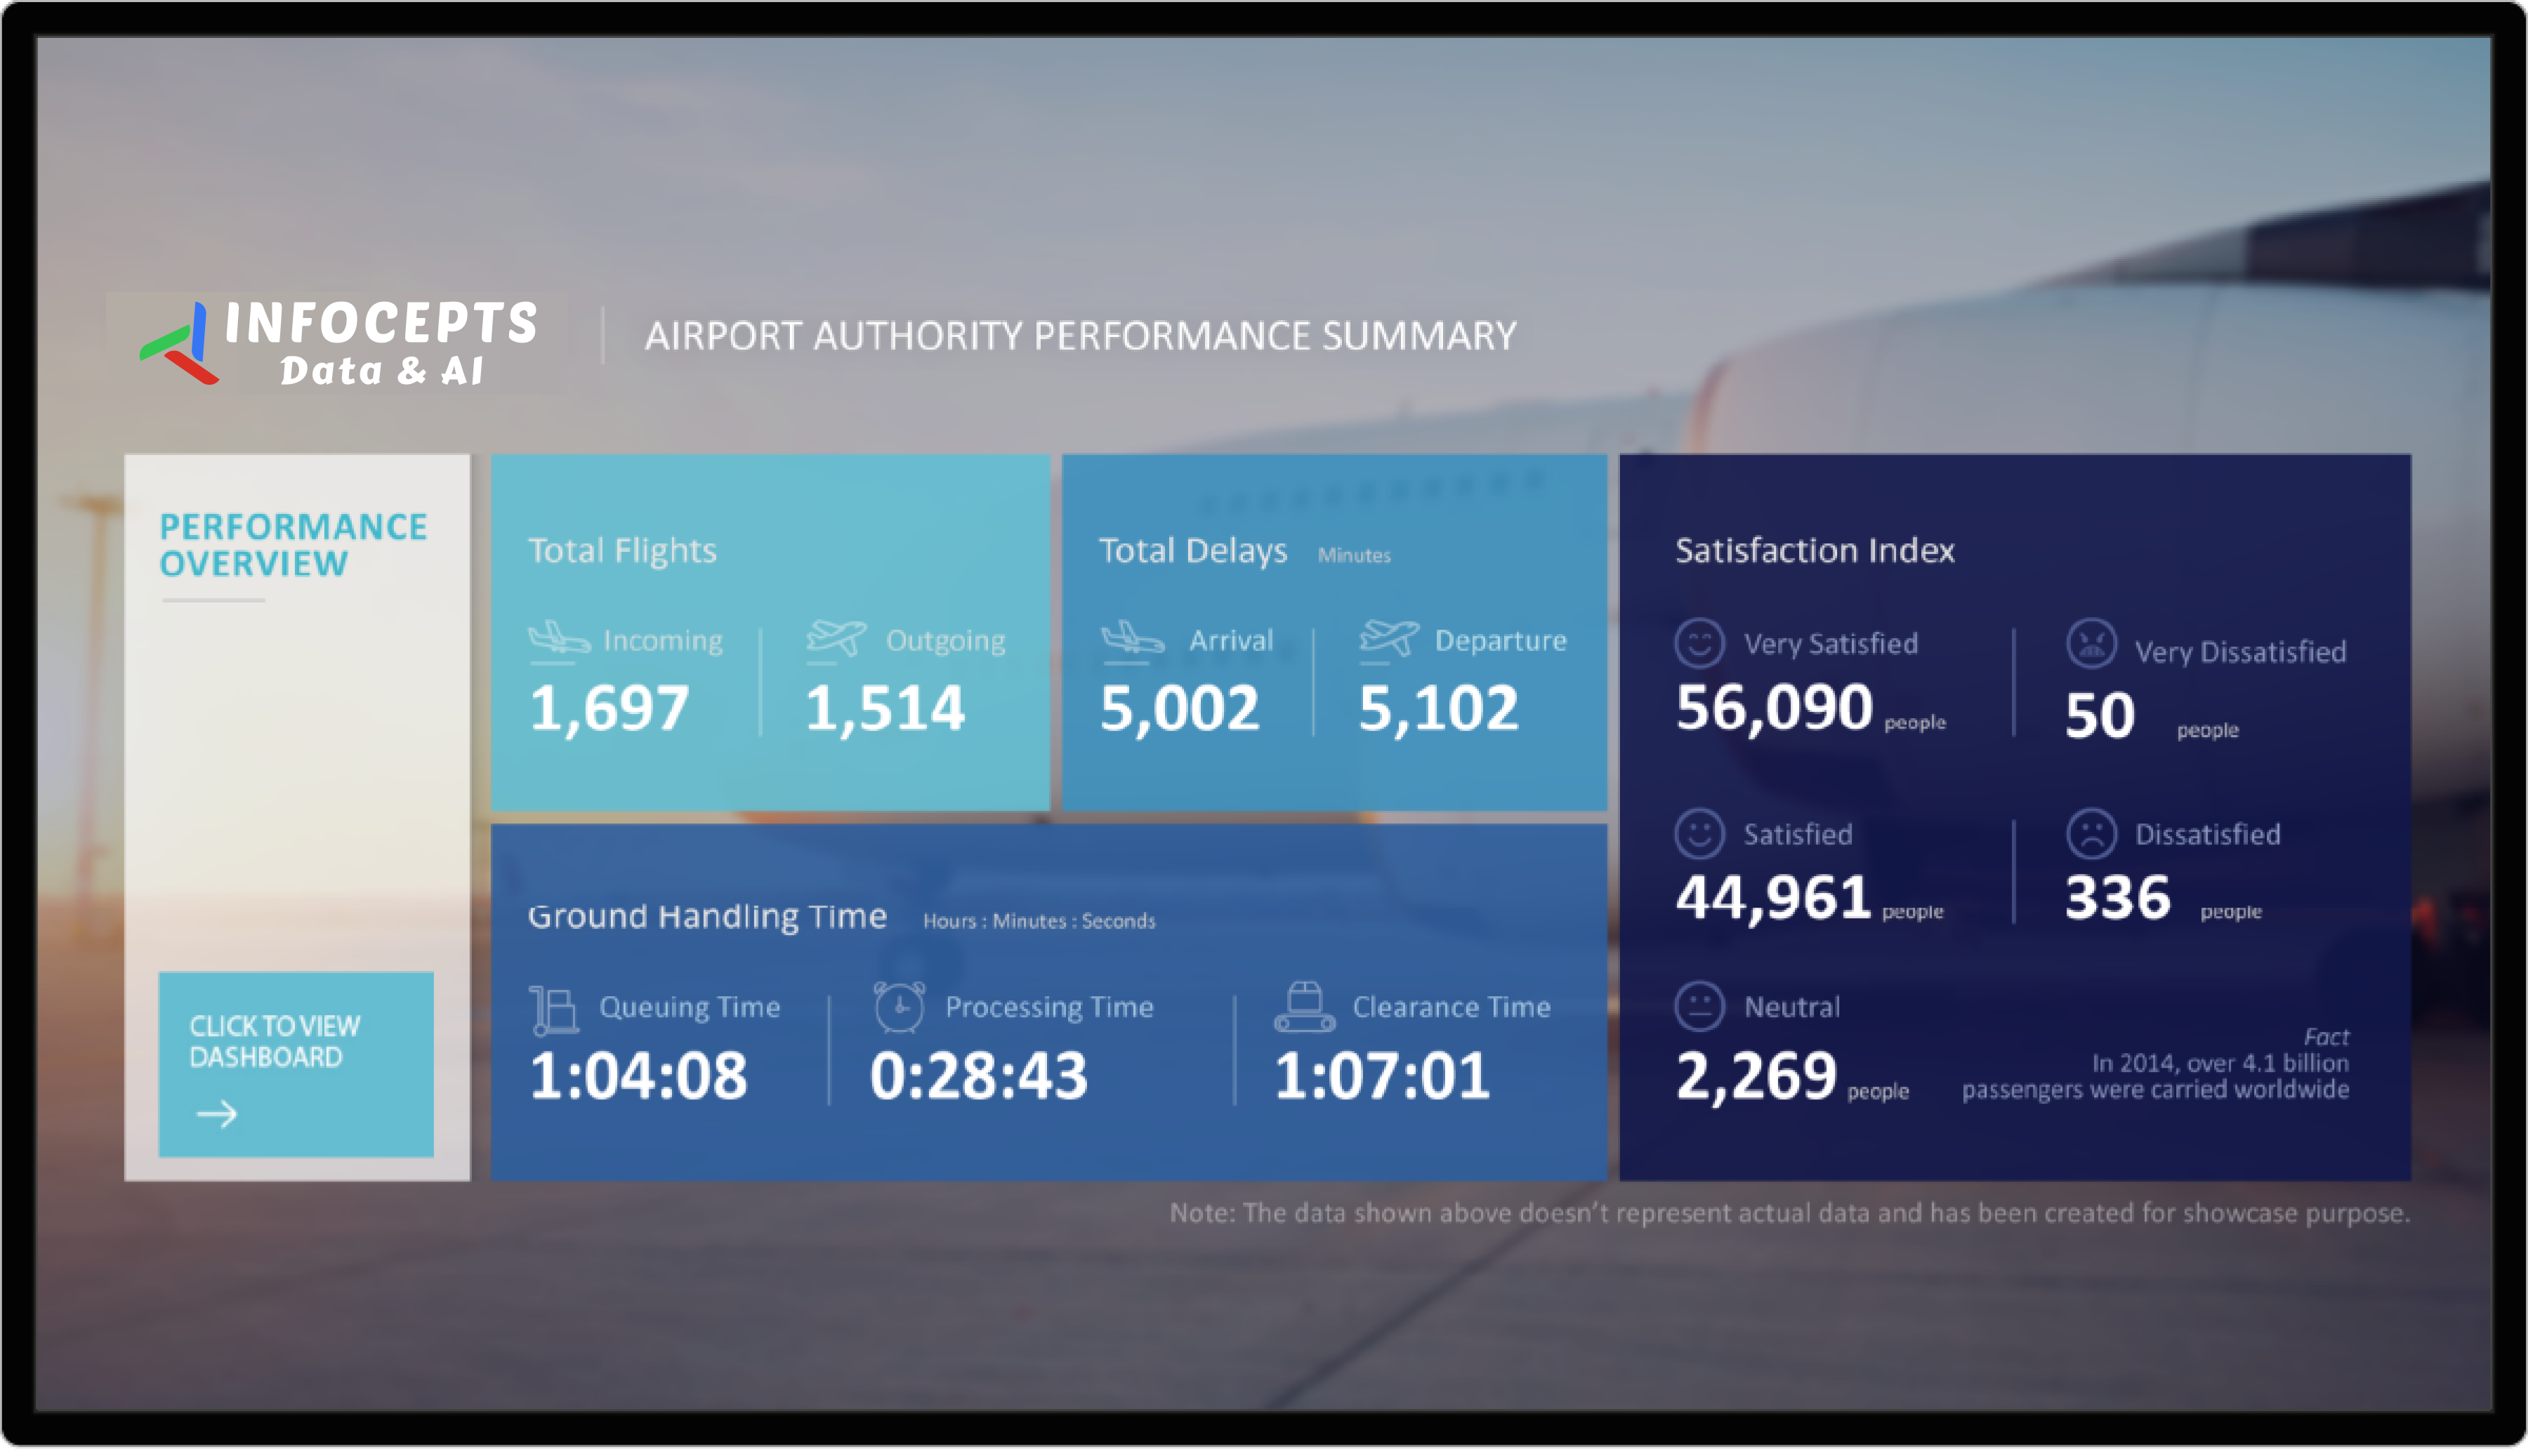
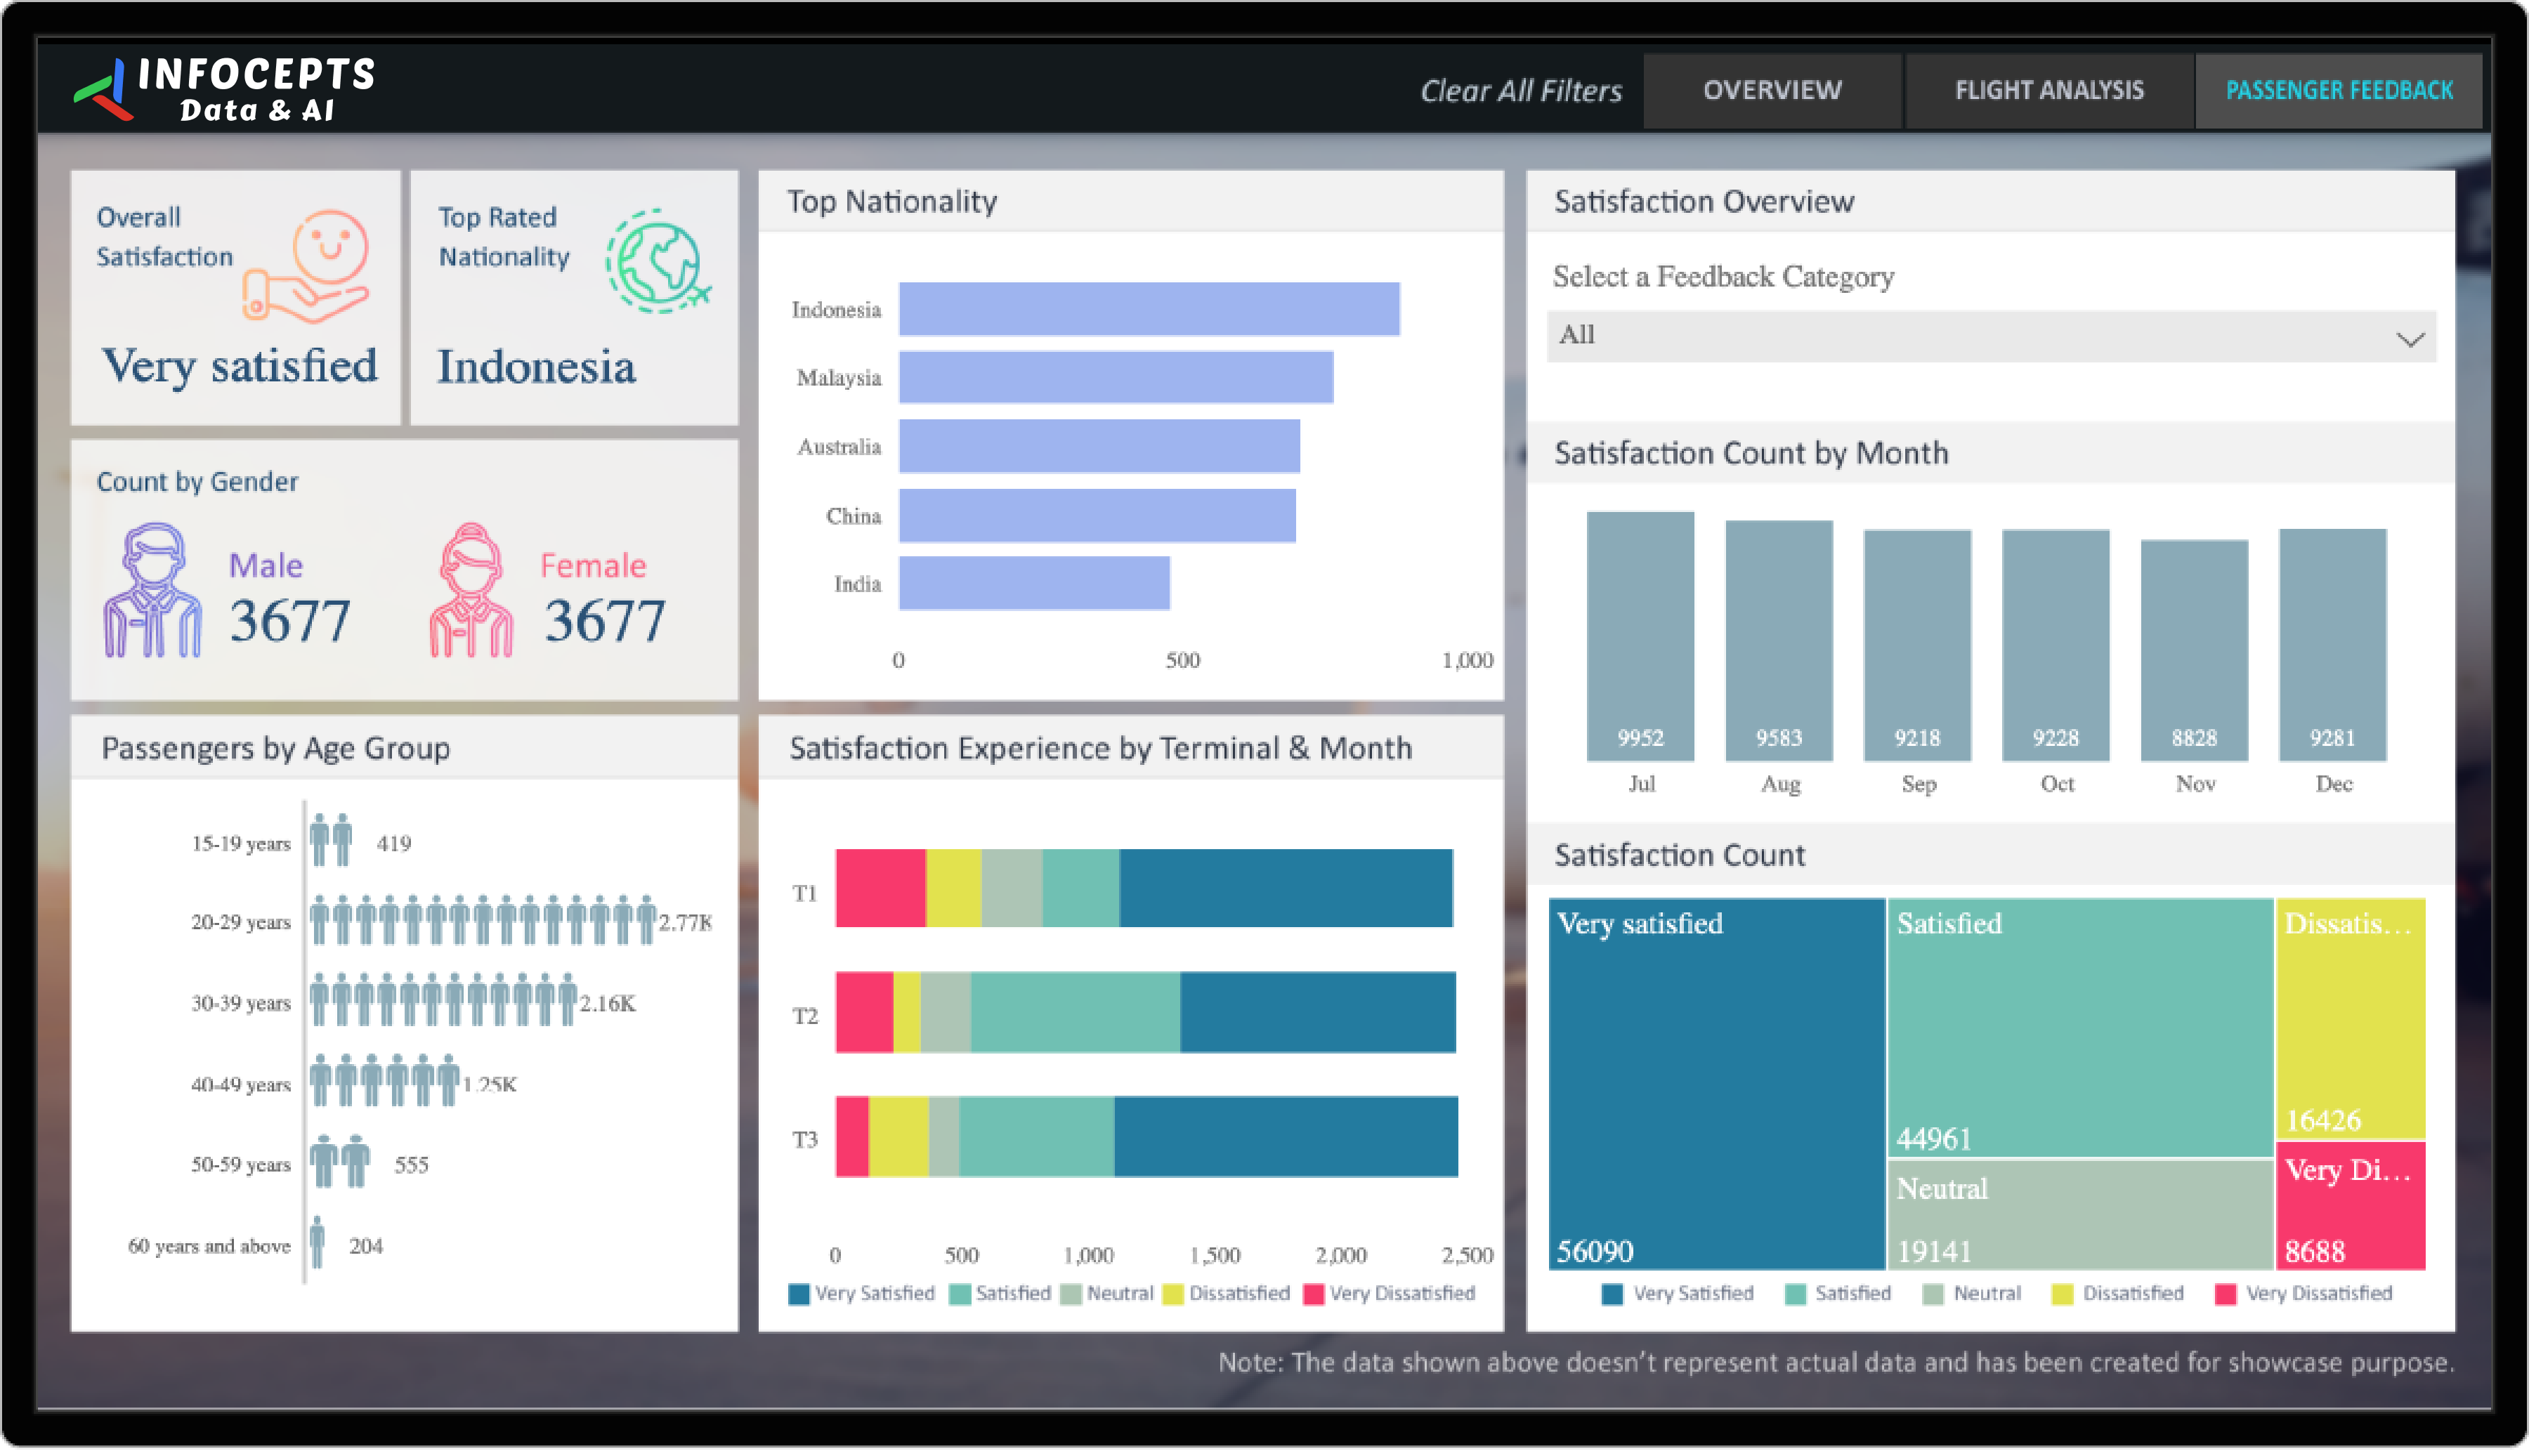
This airport performance dashboard gives airport managers and decision makers one real time view of operations, efficiency, and cost. They use it to respond quickly when conditions change and to make timely adjustments on shift. Infocepts built it for an airport authority on Microsoft Power BI.
What problem did this dashboard by Infocepts solve for the airport authority?
Airport managers needed a live operational picture instead of periodic reports, and one place to look instead of several systems. Infocepts designed a dashboard around user needs, using data product design to surface the few metrics that matter in the moment. Staff can respond to dynamic situations without waiting for a report to catch up.
What does the airport performance dashboard track?
It tracks operational efficiency, cost effectiveness, and passenger experience signals. The view is tailored to how the airport authority already reports internally. It also supports response during flight delays, where a 33% cut in response time is reported. Everything sits in one real time view, so managers do not jump between reports.
Who uses airport performance dashboards in airport authorities and how?
Airport managers and other decision makers use the dashboard during a shift to watch operations and spot inefficiencies. When a disruption such as a flight delay hits, officials check live data and adjust. Cost and efficiency indicators help the same leaders back decisions with current numbers, not last week’s report.
What business impact did the airport authority see after rollout?
Reported results include 72% higher dashboard usage as a central system, 33% lower response time during flight delays, an 89% decrease in errors, and 22% more savings in operational time. Together they point to a tool that staff rely on and that speeds up day to day decisions.
Key metrics: operational efficiency, cost effectiveness, passenger experience, response time during flight delays, error rate, and operational time savings.
Explore more travel examples, such as the air traffic analytics dashboard or the airline operations analytics dashboard, or read our case studies.
Want an airport performance dashboard for your operation? Talk to our team about what to track and how to build it.

 Pranali Lanjewar



