47%
Increase in Procurement Decision-Making Efficiency
38%
Reduction in User Interaction Time
42%
Growth in On-Time Deliveries through Optimized Supplier Selection
35%
Decrease in Procurement Lead Time
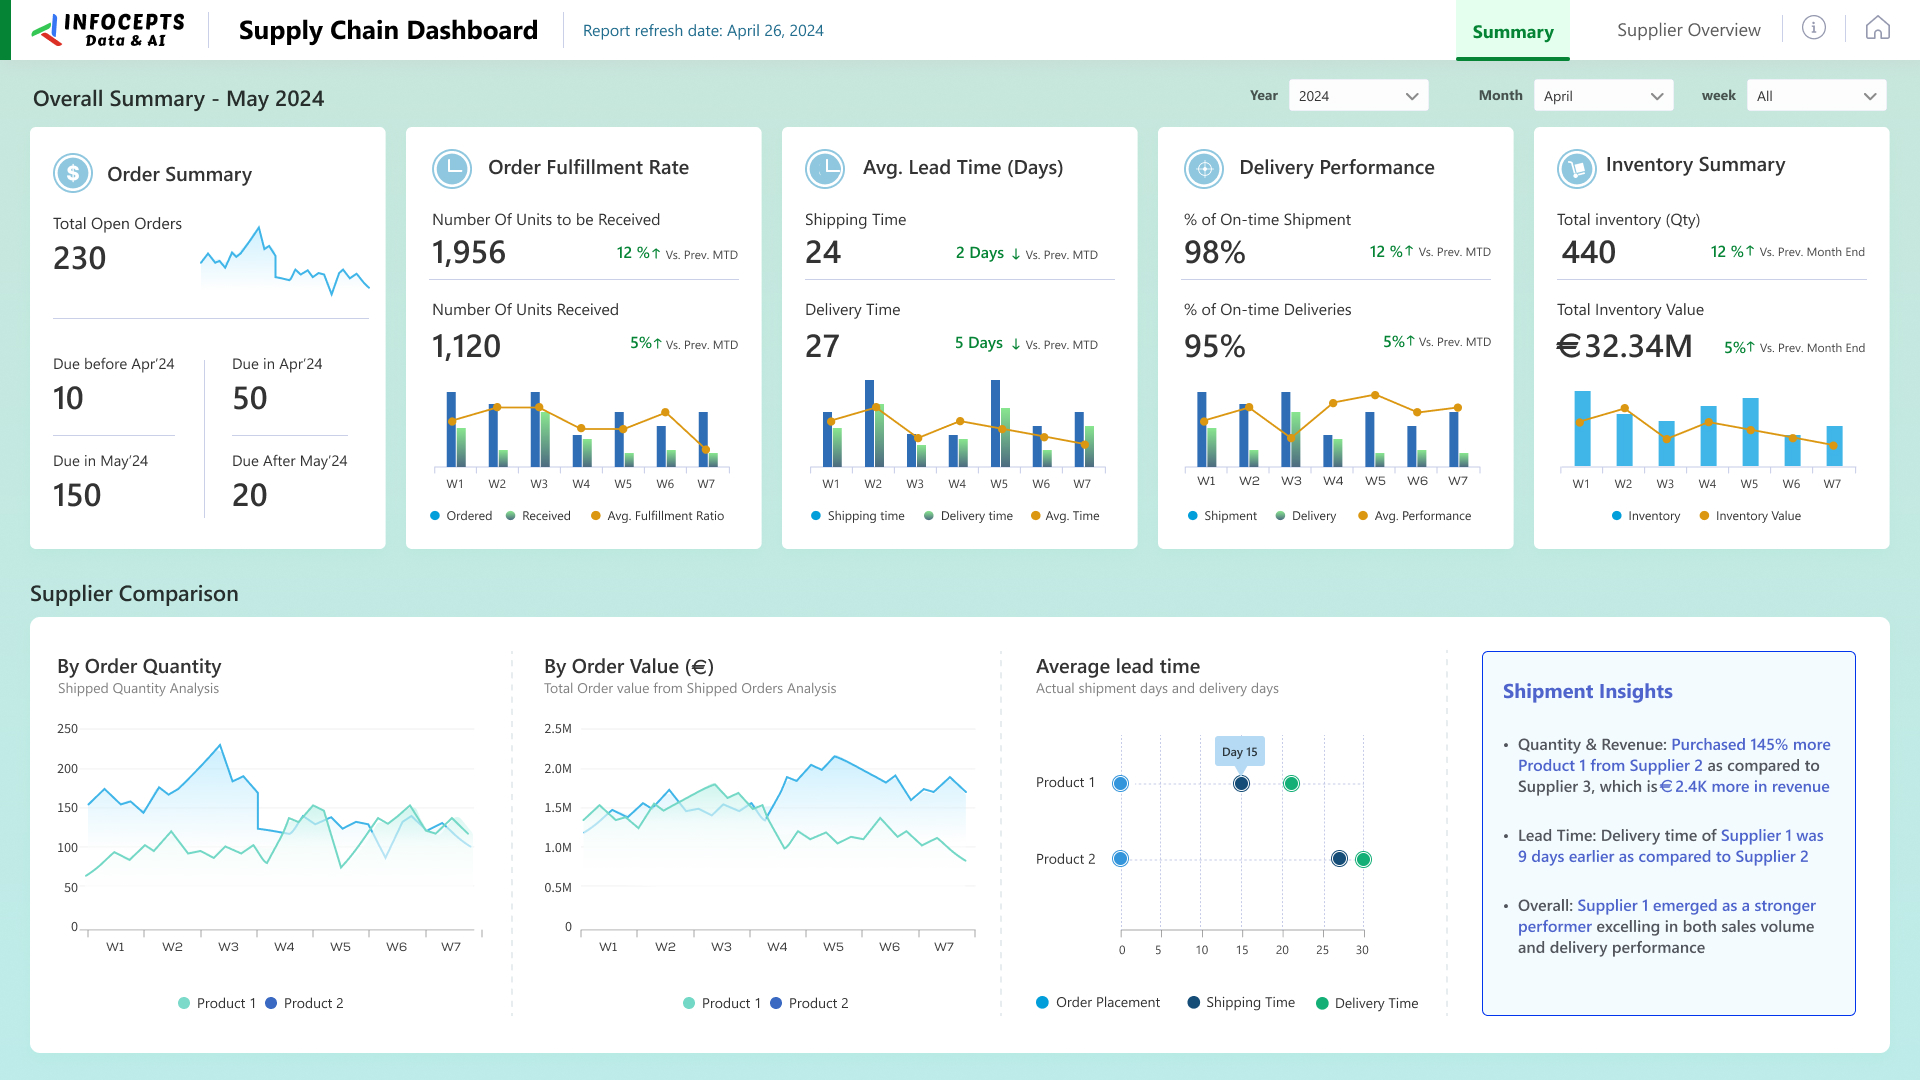
This supply chain analytics dashboard compares suppliers on quantity, revenue, and lead time. Procurement and supply chain leaders in Retail & CPG use it to find high performing suppliers and tighten procurement strategy. Infocepts built it on Power BI, with comparative visuals that make supplier differences easy to see.
What problem did this dashboard by Infocepts solve for the procurement team?
Supplier performance is hard to see when it lives in invoices and shipment records. Infocepts built one dashboard that compares every supplier on the same metrics: quantity, revenue, and lead time. Procurement and logistics data comes together through data engineering and integration, so buyers judge suppliers on a common basis.
What does the supply chain performance dashboard track?
It tracks supplier performance by quantity, revenue, and lead time. Comparative analysis puts every supplier on the same metrics, so high performers stand out. Lead time by supplier shows where delivery delays come from. Smart insights and data driven recommendations point to where procurement can streamline its strategy.
Who uses supply chain performance dashboards in Retail & CPG companies and how?
Procurement teams compare suppliers to decide who gets orders, who needs a renegotiation, and where to diversify. Supply chain and operations leaders watch lead time and delivery performance across the supply base. Both groups work from consistent comparative data rather than anecdote, which makes supplier conversations easier to run.
What business impact did the procurement team see after rollout?
Reported results include a 47% increase in procurement decision making efficiency and a 35% decrease in procurement lead time. It also reports 42% growth in on time deliveries through optimized supplier selection, and a 38% reduction in user interaction time. These are the results shown for the procurement team.
Key metrics: supplier quantity, supplier revenue, lead time, on time deliveries, procurement lead time, and procurement decision making efficiency.
Explore more examples in the Retail & CPG section, see the supply chain intelligence dashboard, or read our case studies.
Want a supply chain performance dashboard for your suppliers? Talk to our team about what to track and how to build it.

 Pranali Lanjewar