23%
Increase in Lead Conversion Rates 51% 43% 27%
51%
Growth in Distinct Opportunities
43%
Improvement in Individual Performance
27%
Increase in New Customer/Client Acquisition
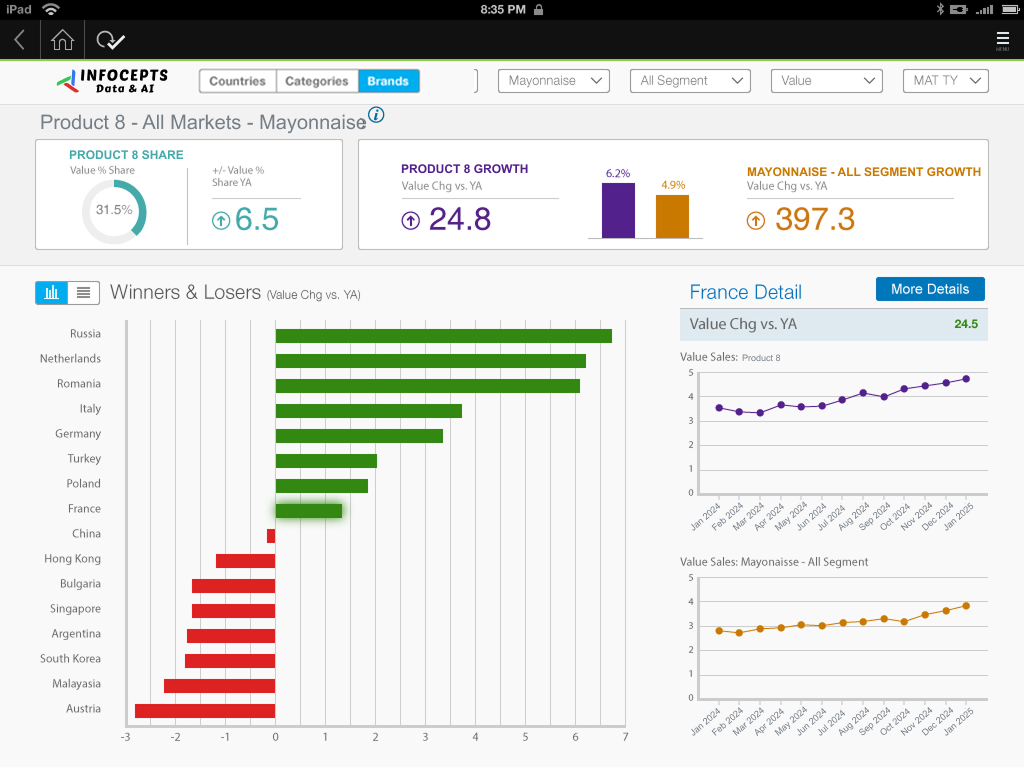
This marketing performance dashboard gives marketing managers and teams one view of lead conversion rates, revenue generation, and customer acquisition. They use it to see how campaigns, leads, and opportunities perform, and where to focus next across regions. Infocepts built it on Tableau.
It also shows individual performance, team efficiency, and sales growth. Infocepts designs views like these through data product design.
See related examples, including customer analytics for marketing and sales and customer segmentation, or browse our case studies.
Want a marketing performance dashboard for your team? Talk to our team.
Frequently asked questions
It brings lead conversion rates, revenue generation, and customer acquisition into one KPI view, so marketing managers see campaign, lead, and opportunity performance together instead of across separate reporting tools.
Visibility into which campaigns and leads are actually converting lets teams reallocate budget and attention toward what is working, without waiting for an end of quarter review.
Showing efficiency at the individual or team level alongside overall campaign results helps identify where coaching or process changes will have the most impact.
Marketing managers and leadership responsible for campaign strategy, lead conversion, and revenue attribution across regions.
By surfacing which leads and campaigns show the strongest conversion signals, marketing teams can prioritize follow up where it is most likely to pay off.
By connecting CRM and campaign data into a BI platform through Business Analytics services.

 Pranali Lanjewar