21%
Reduced time to Insights
33%
Reduced maintenance and cost efforts
62%
Increase in informed decision-making
18%
Enhanced operational efficiency
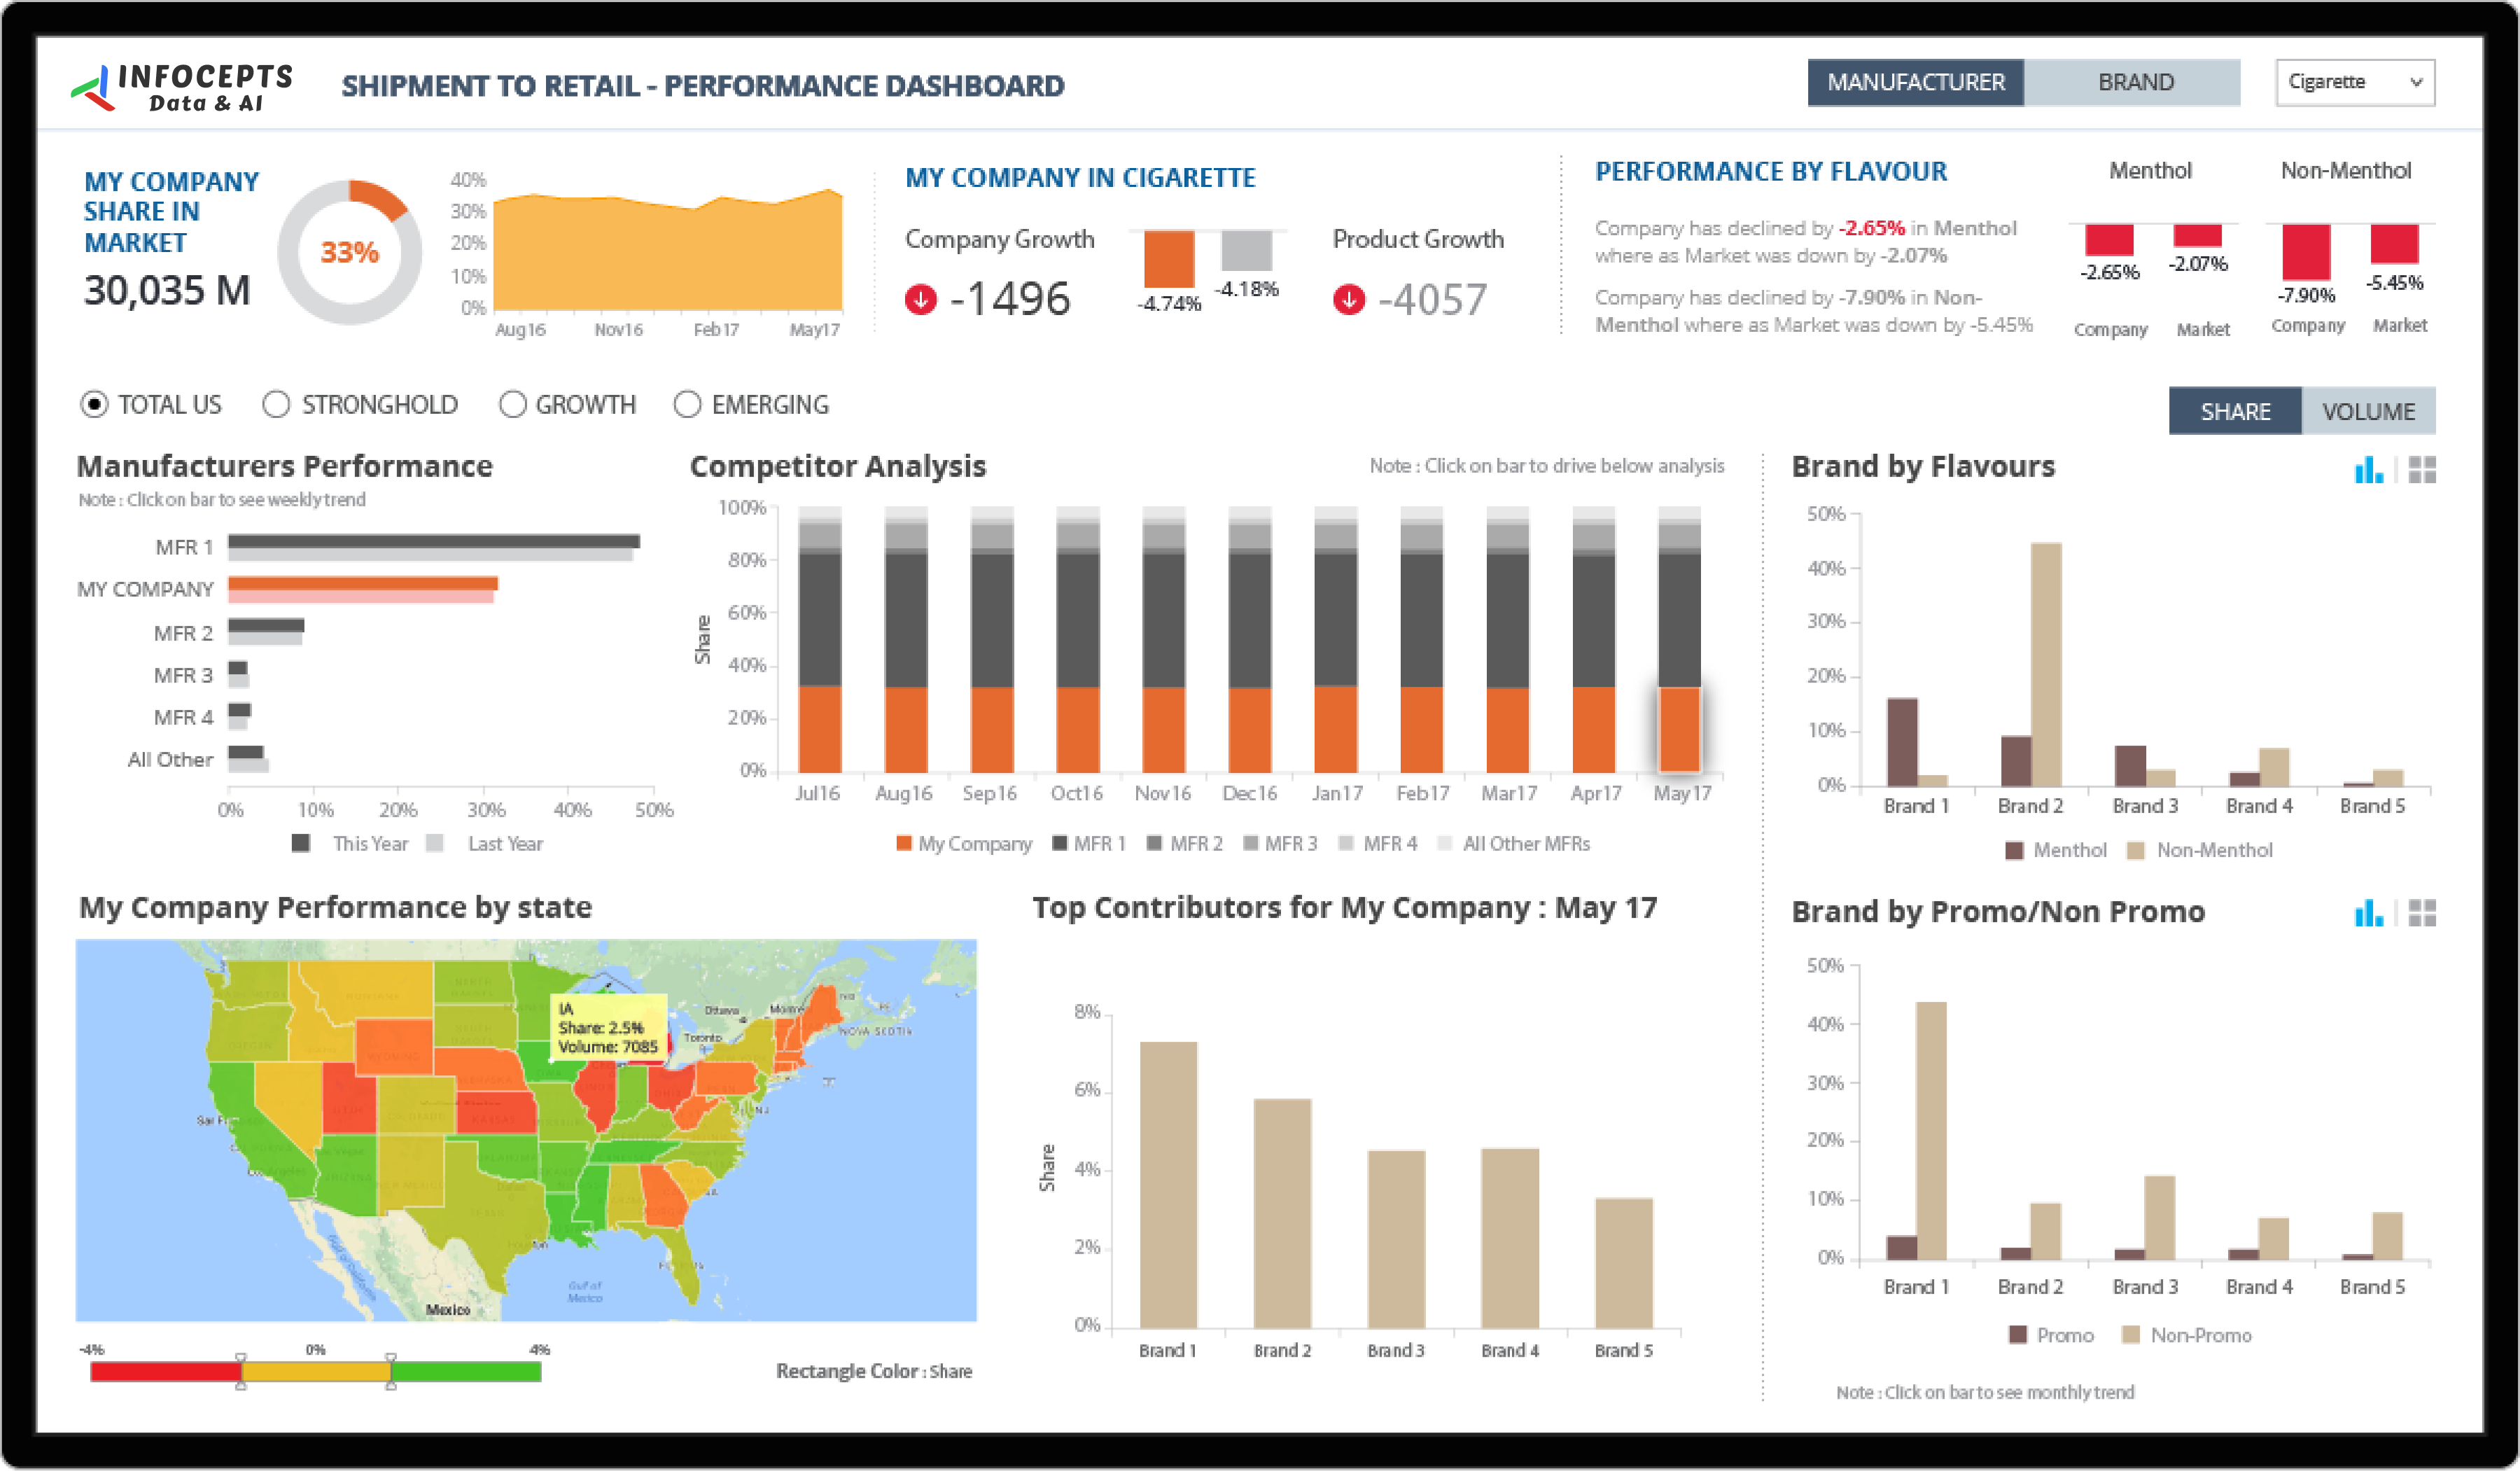
This shipment tracking dashboard, called Shipment to Retail Performance, gives manufacturers and retailers a real time view of product movement, brand performance, and competitor benchmarks across geographies. Supply chain leaders use it to judge shipment efficiency, inventory turnover, and demand trends, then adjust stock levels and distribution. Infocepts built it in Tableau.
More supply chain and retail examples sit in the Retail & CPG section, including supply chain performance analytics and inventory analytics.
Want a shipment tracking dashboard for your supply chain? Talk to our team.
Frequently asked questions
It monitors product movement from shipment through retail, alongside brand performance and inventory turnover, so manufacturers and retailers see the whole distribution picture in one place instead of separate logistics and sales reports.
Visibility into inventory turnover and demand trends lets businesses adjust stock levels before overstock or shortage becomes a costly problem, rather than reacting after the fact.
Comparing brand and shipment performance across geographies against competitive benchmarks shows whether an issue is company specific or market wide, which changes how a business responds.
Manufacturers and retailers managing distribution across multiple geographies, along with supply chain and operations leadership.
Early visibility into shipment efficiency and demand trend shifts gives teams lead time to adjust distribution strategy before a disruption fully hits the shelf.
By connecting shipment, inventory, and sales data into a BI platform through Business Analytics services, drawing on Retail & CPG industry experience.

 Pranali Lanjewar