70x
Reduced time to insight
55%
Increased efficiency in student performance analysis and reporting
27%
Increased efficiency in attendance tracking
72%
Increased identification of at-risk students upfront
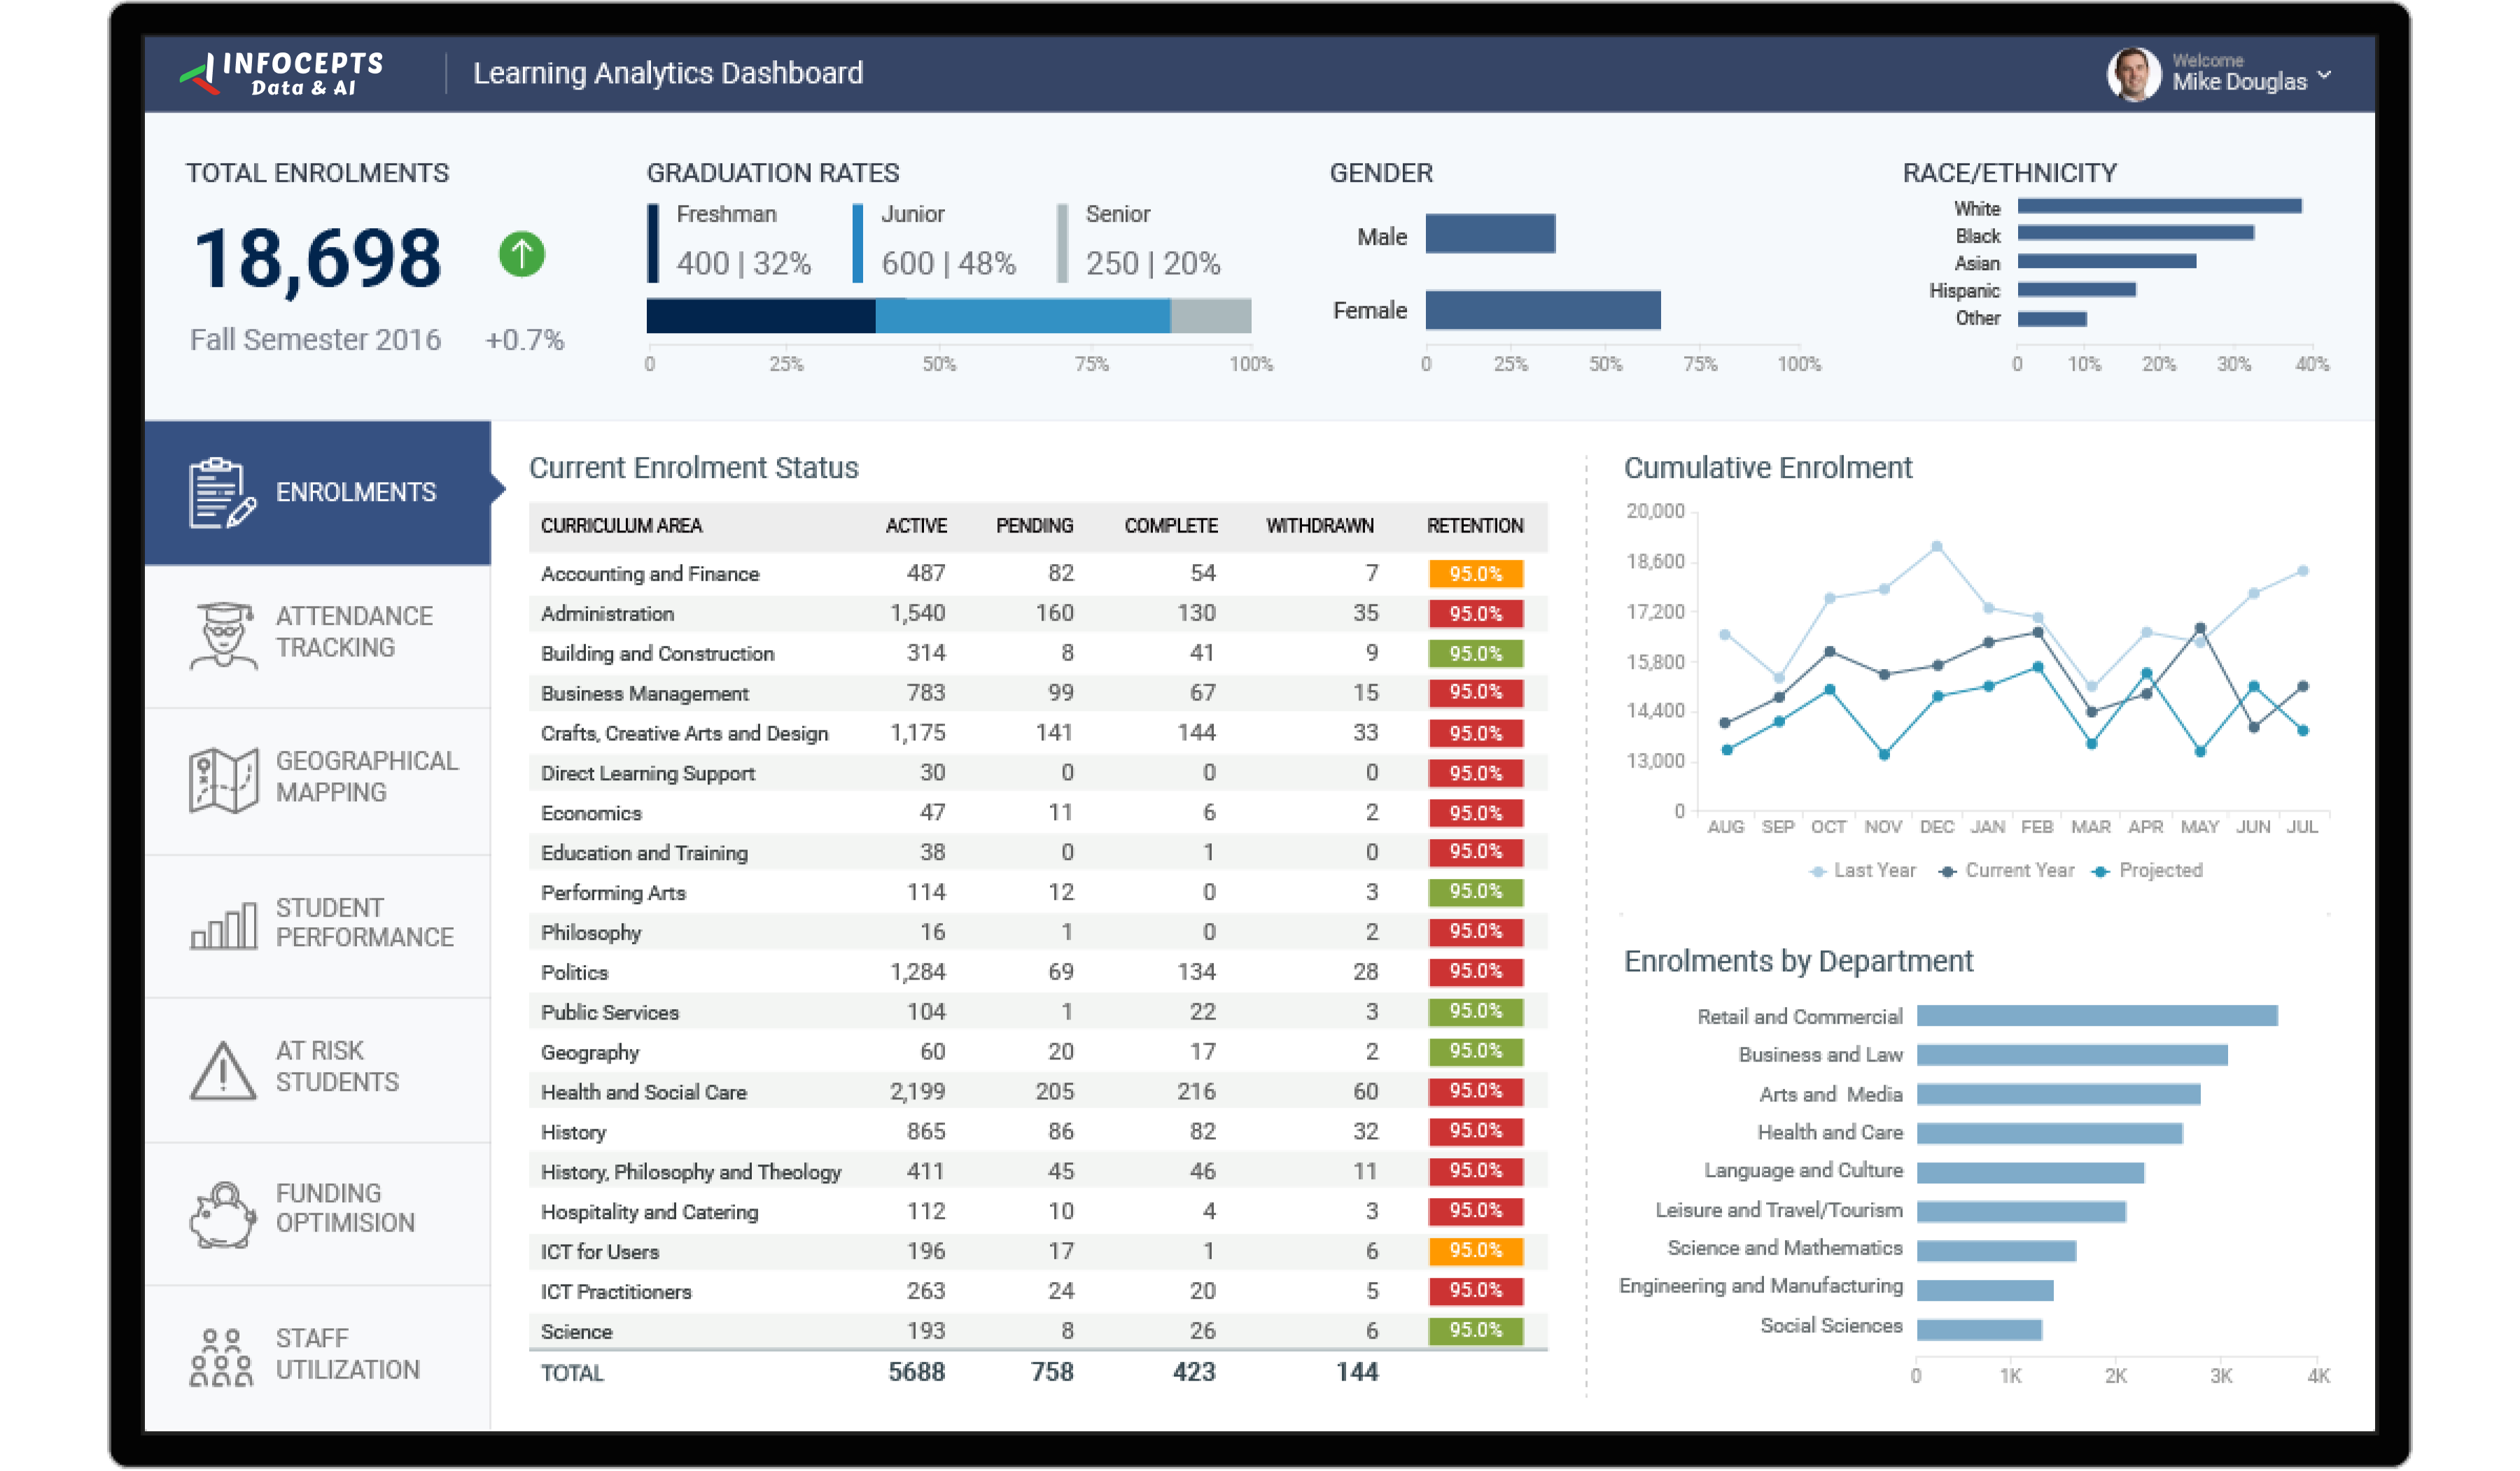
This student performance dashboard gives college management a 360 degree view of student performance, course enrollment, attendance, and class comparisons. Administrators use it to adjust course offerings, improve attendance, and spot at risk students early. Infocepts built it on Tableau and runs it on real time analytics.
It also shows enrollment trends across demographics, so leaders see where demand is moving. Infocepts delivers this kind of performance monitoring and reporting for institutions.
See related education dashboards, including student application analytics for universities and facility management insights, or browse our case studies.
Want a student performance dashboard for your institution? Talk to our team.
Frequently asked questions
It brings student performance, course enrollment, attendance, and class comparisons into one 360-degree view, so college management can act on trends instead of reviewing each metric in a separate system.
Real time analytics surface warning signs, such as declining attendance or performance, while there is still time to intervene, instead of discovering the pattern at semester end.
Adjusting course offerings, improving attendance strategies, and understanding enrollment trends across demographics, backed by current data rather than a historical report.
College and university administrators, academic advisors, and institutional leadership responsible for student success and enrollment planning.
Yes. Class comparisons and demographic breakdowns are built in, so patterns that would be invisible in an aggregate number become visible.
By connecting student information systems into a BI platform through Business Analytics services.

 Pranali Lanjewar