96%
Faster Time to Insight
62%
Reduction in Maintenance & Cost Efforts
97%
Accuracy in Comparative Analysis
42%
Increase in Focus on High-Impact Projects
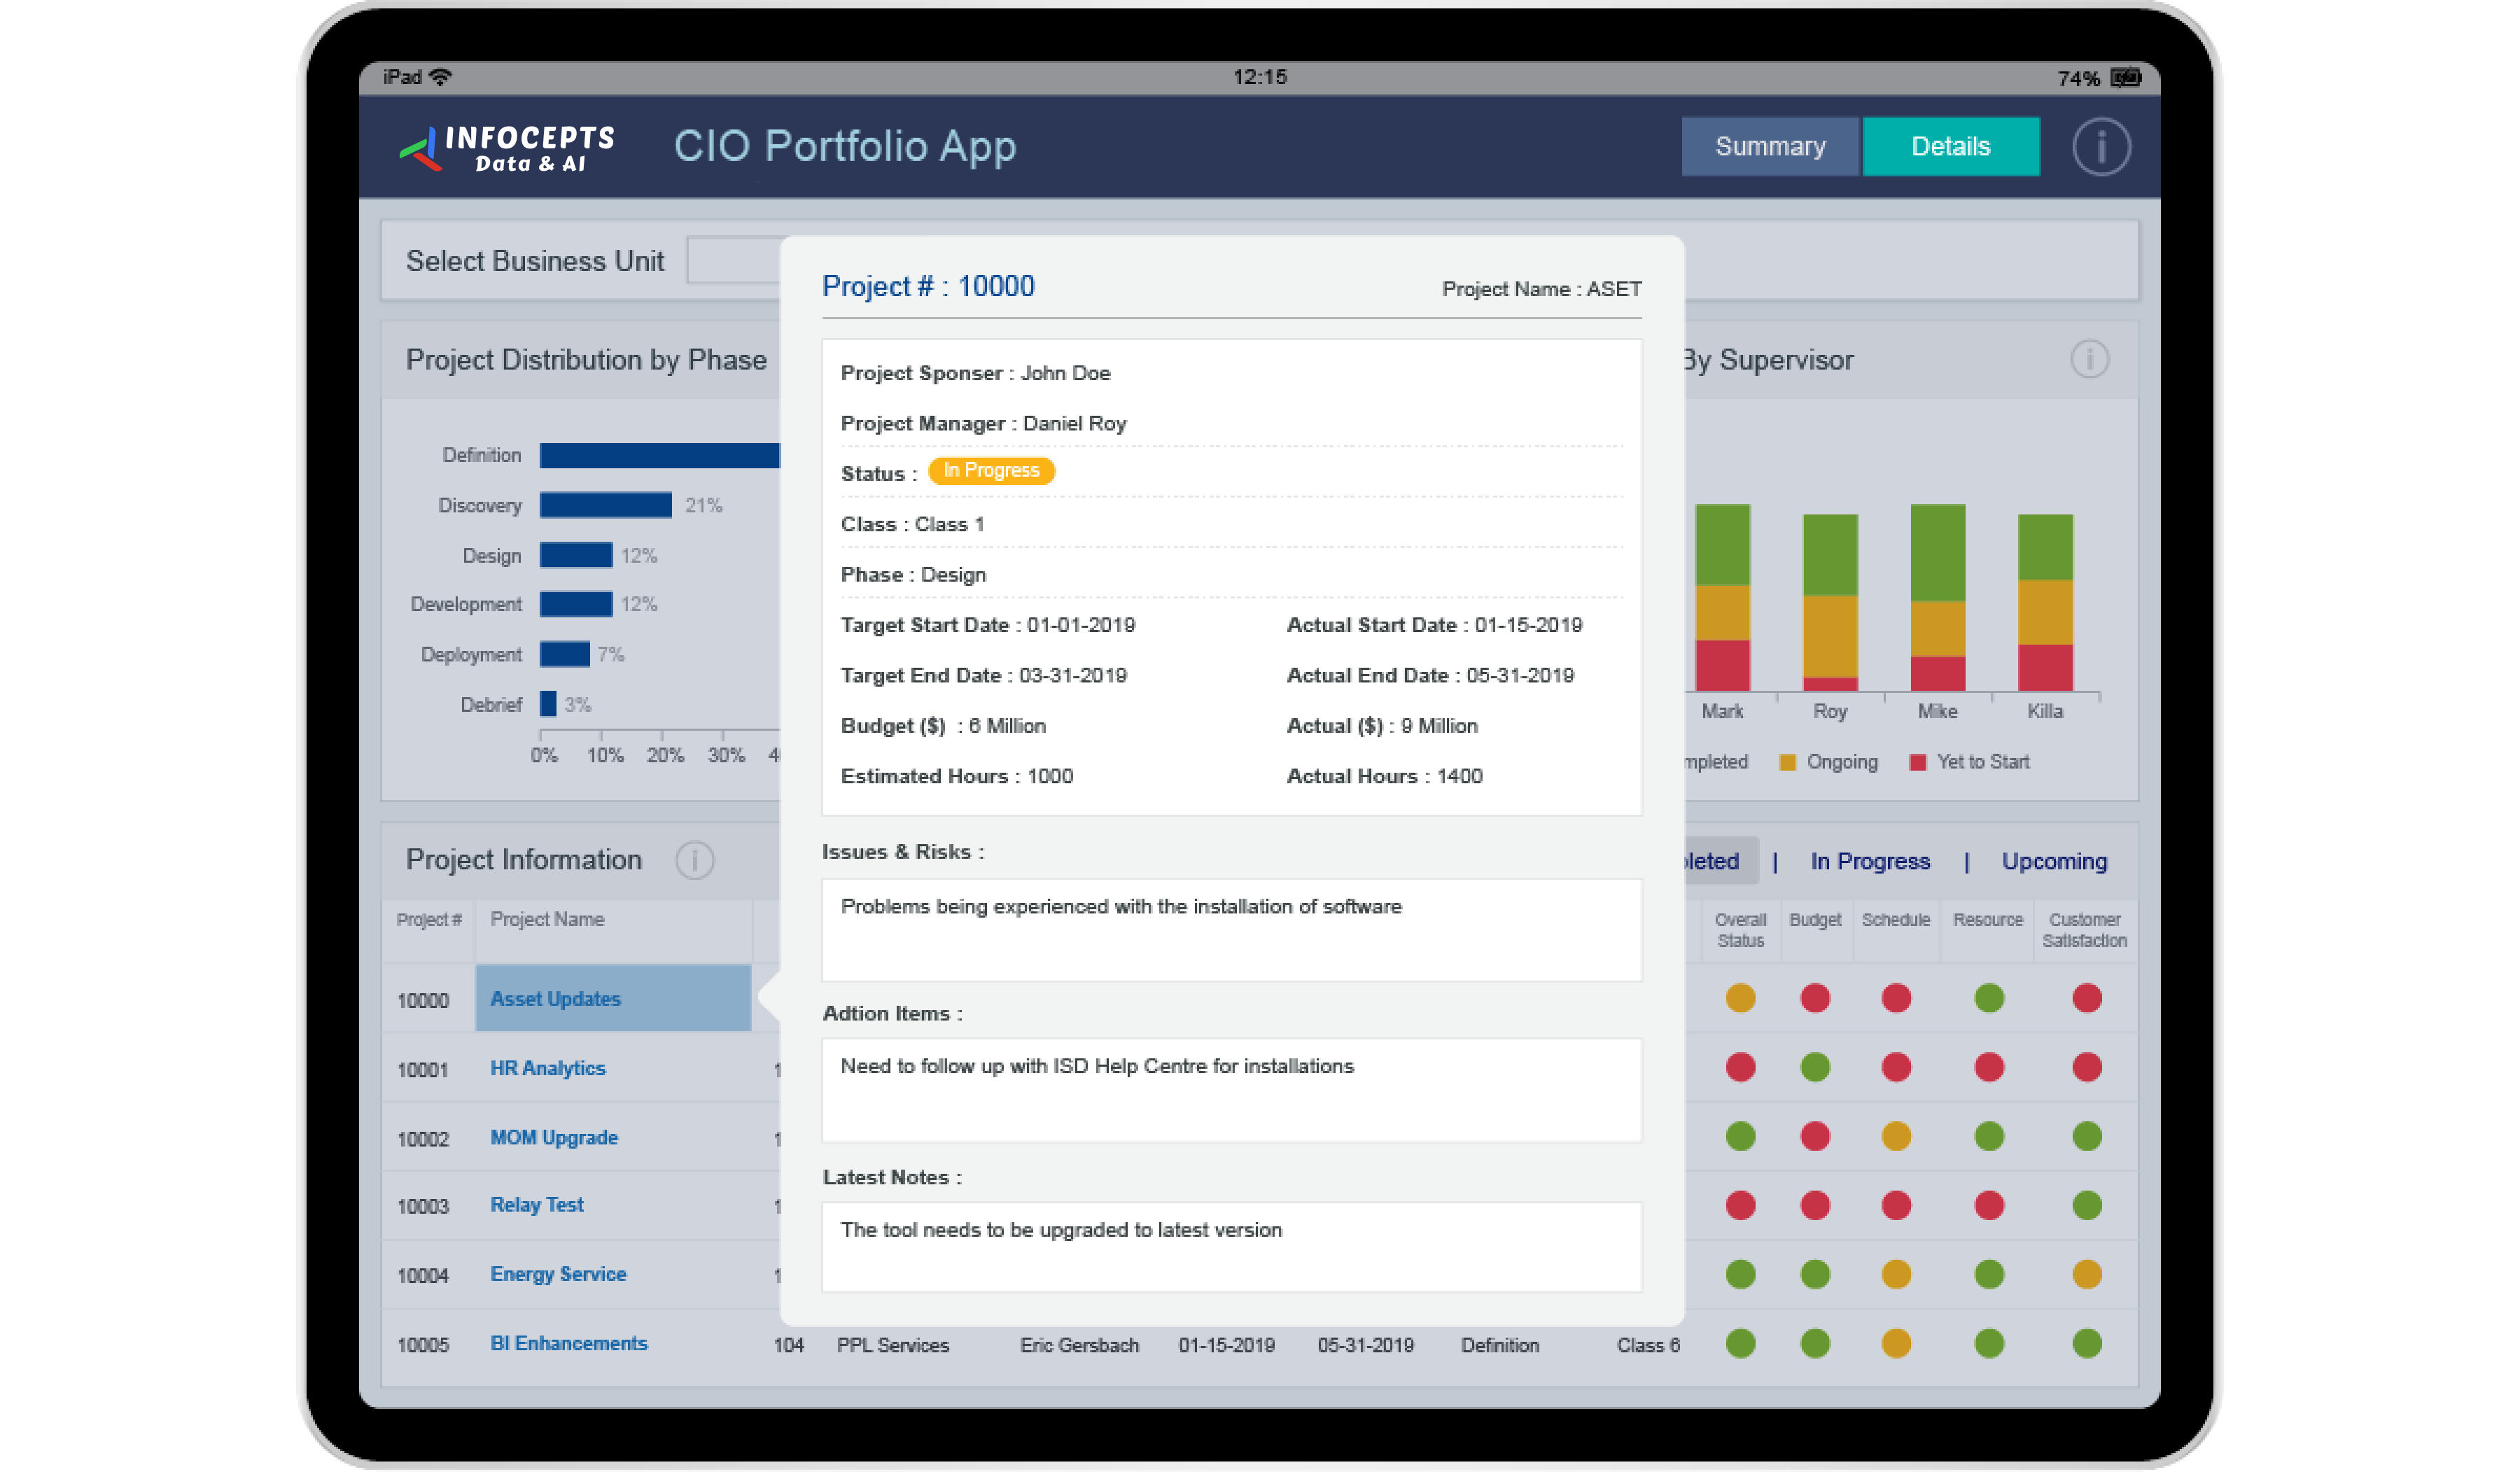
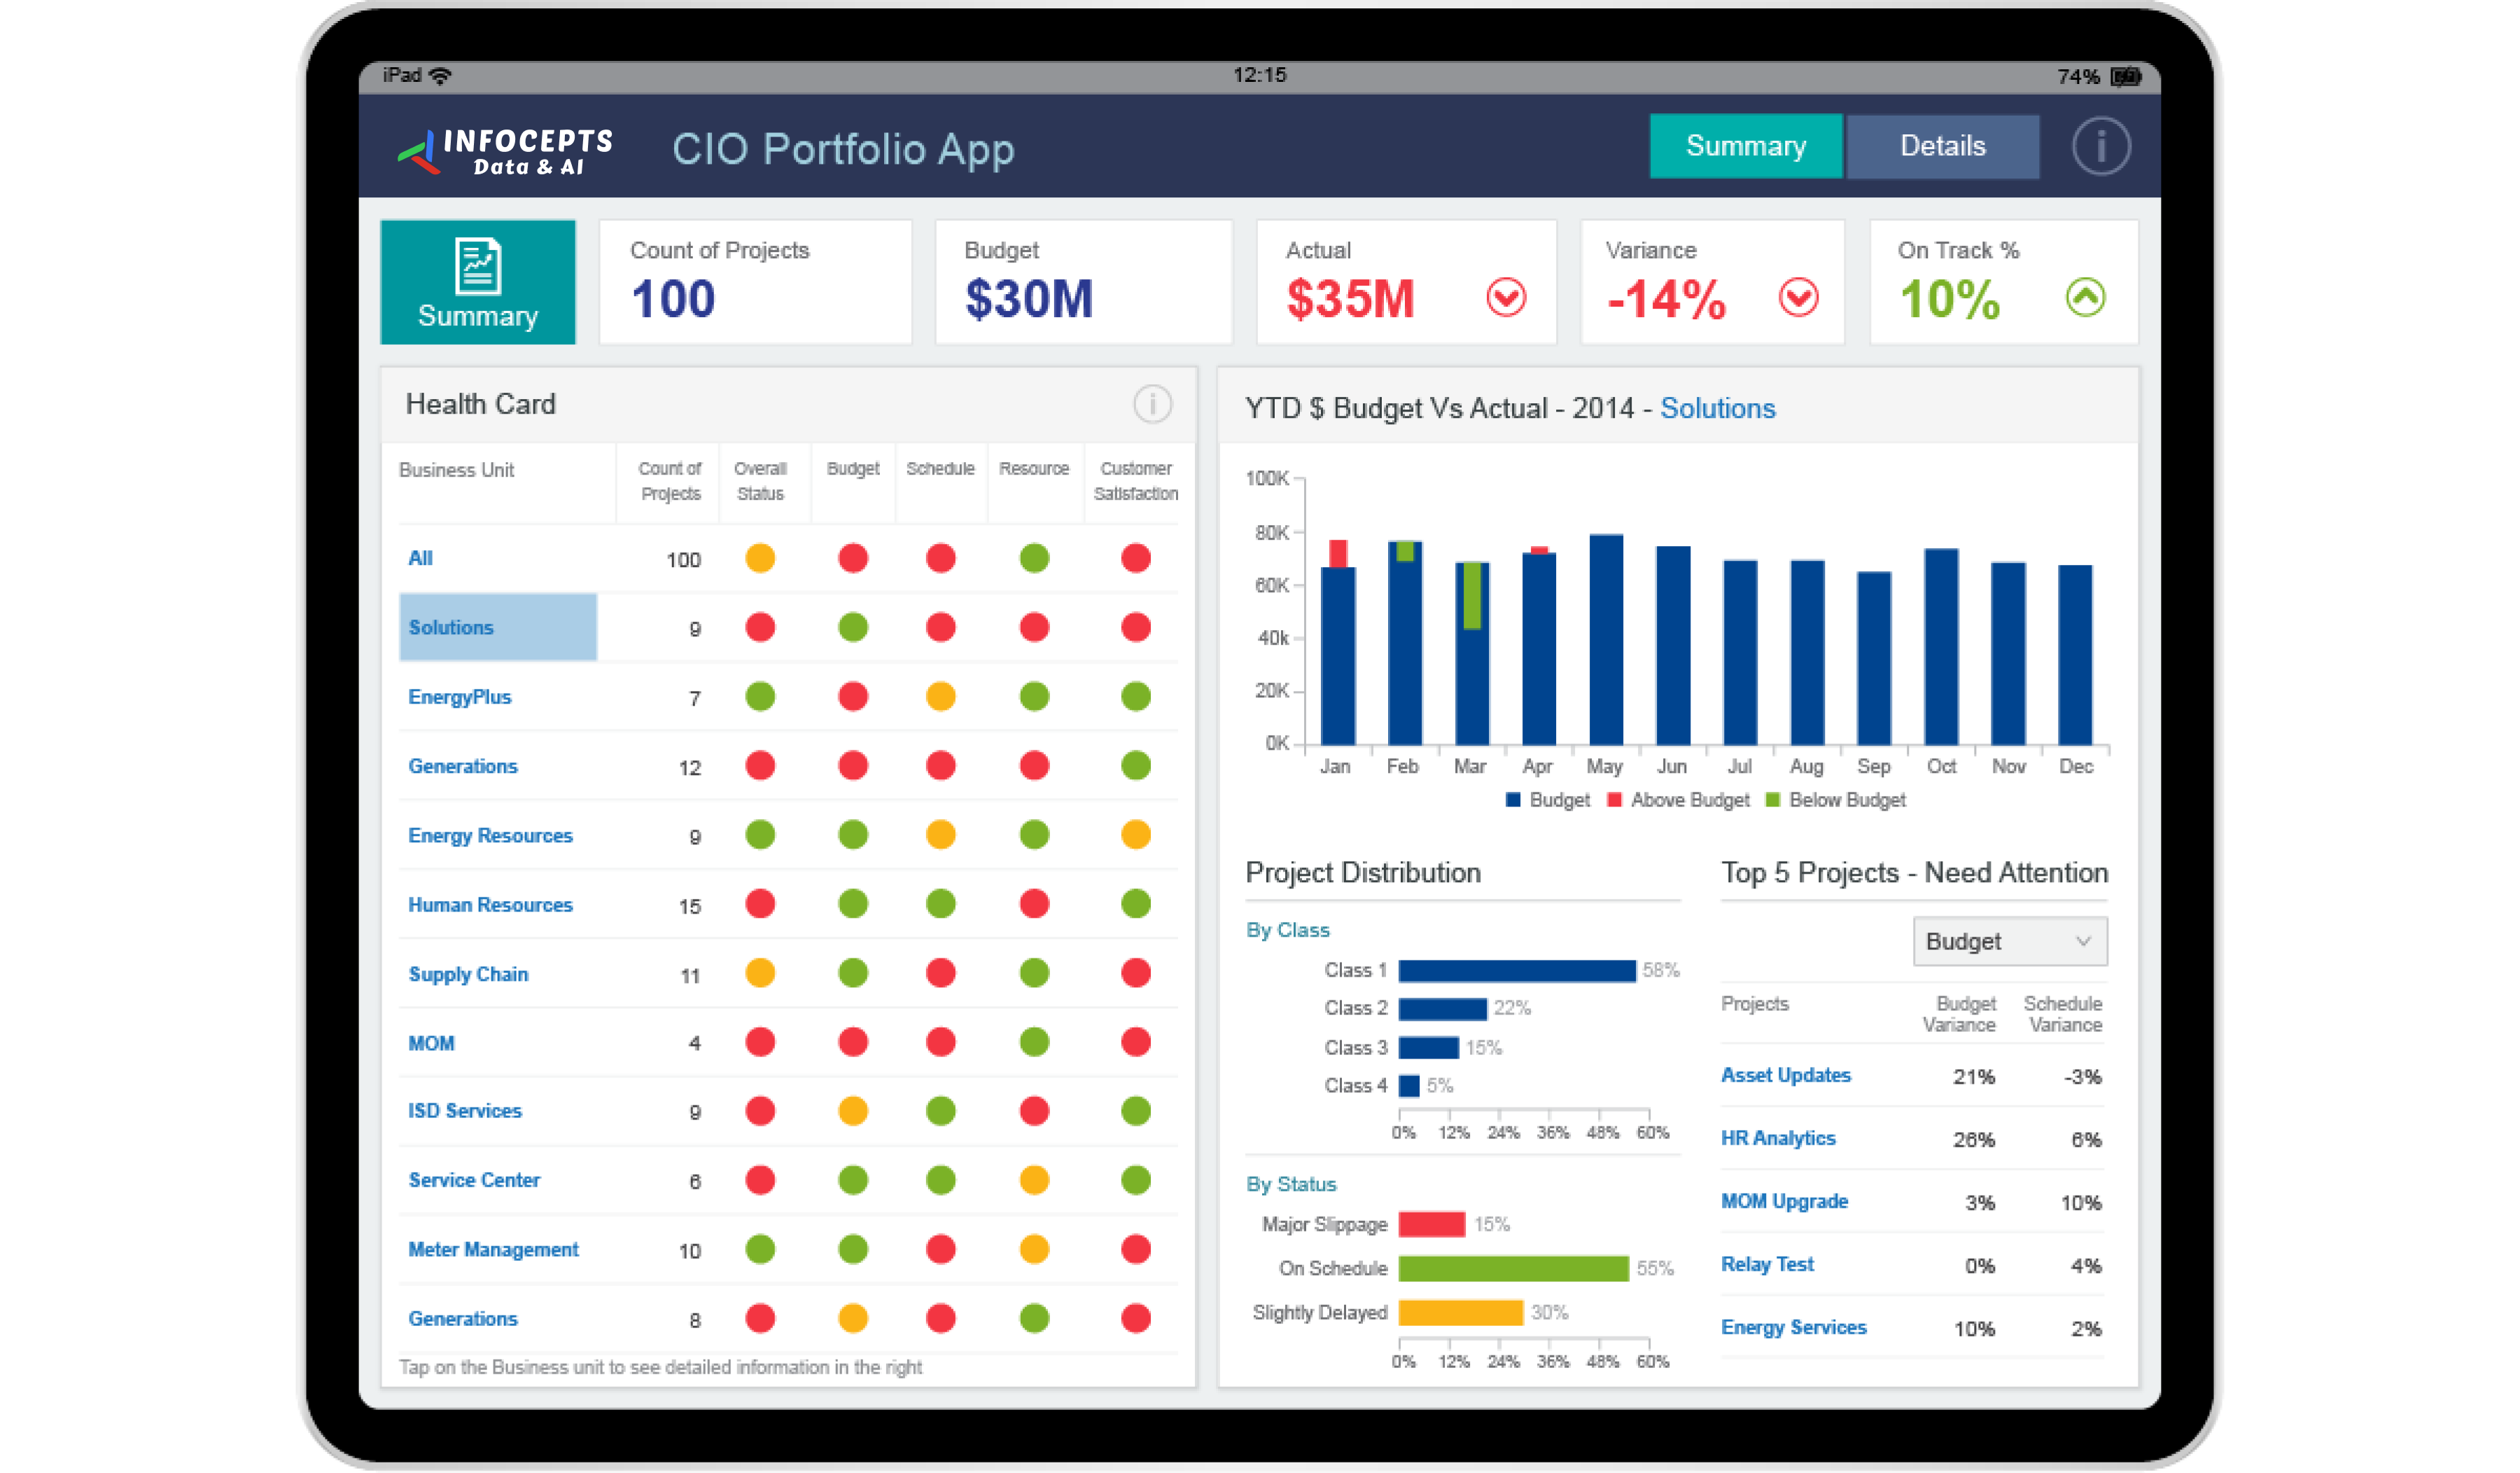
This project management dashboard gives project managers, CIOs, and executives in the energy and utilities sector one view of budgets, timelines, risks, and resource allocation across large Information Systems projects. It supports the call on where to step in before a project slips. Infocepts built it on MicroStrategy using data storytelling and design thinking.
What problem did this dashboard by Infocepts solve for the energy and utilities organization?
Large Information Systems projects compete for the same people and money, and a budget variance or risk on one can hit the others. Leaders often learn of an overrun only at project close. Infocepts pulled budget, timeline, and risk data into one view through data engineering and integration, so problems show up while there is still time to act.
What does the project management dashboard track?
It tracks budgets and budget variances, timelines, risk factors, and resource allocation across projects. Leaders can see project health at a glance, spot bottlenecks, and compare projects that draw on the same resources. It is a portfolio level view, not a single project status report.
Who uses project management dashboards in energy and utilities companies and how?
Project managers use the dashboard to find bottlenecks and budget variances in their own programs. CIOs and executives use the portfolio view to decide which initiatives deserve attention and where to move resources. Everyone sees project health without waiting for a status meeting. That keeps decisions tied to current numbers.
What business impact did the energy and utilities organization see after rollout?
Reported results include 96% faster time to insight, a 62% reduction in maintenance and cost efforts, and 97% accuracy in comparative analysis. It also reports a 42% increase in focus on high impact projects, the work that carries the most weight in the portfolio. Those are the figures shown for this rollout.
Key metrics: budgets, budget variance, project timelines, risk factors, resource allocation, and project health.
See more data visualization examples from other teams and industries, or browse our case studies.
Want a project management dashboard for your portfolio? Talk to our team about what to track and how to build it.

 Pranali Lanjewar