41%
Faster Time to Insights
33%
Reduction in Maintenance and Cost Efforts
82%
Higher Accuracy in Sales & Rental Margin Trends
22%
Increase in Customer Retention
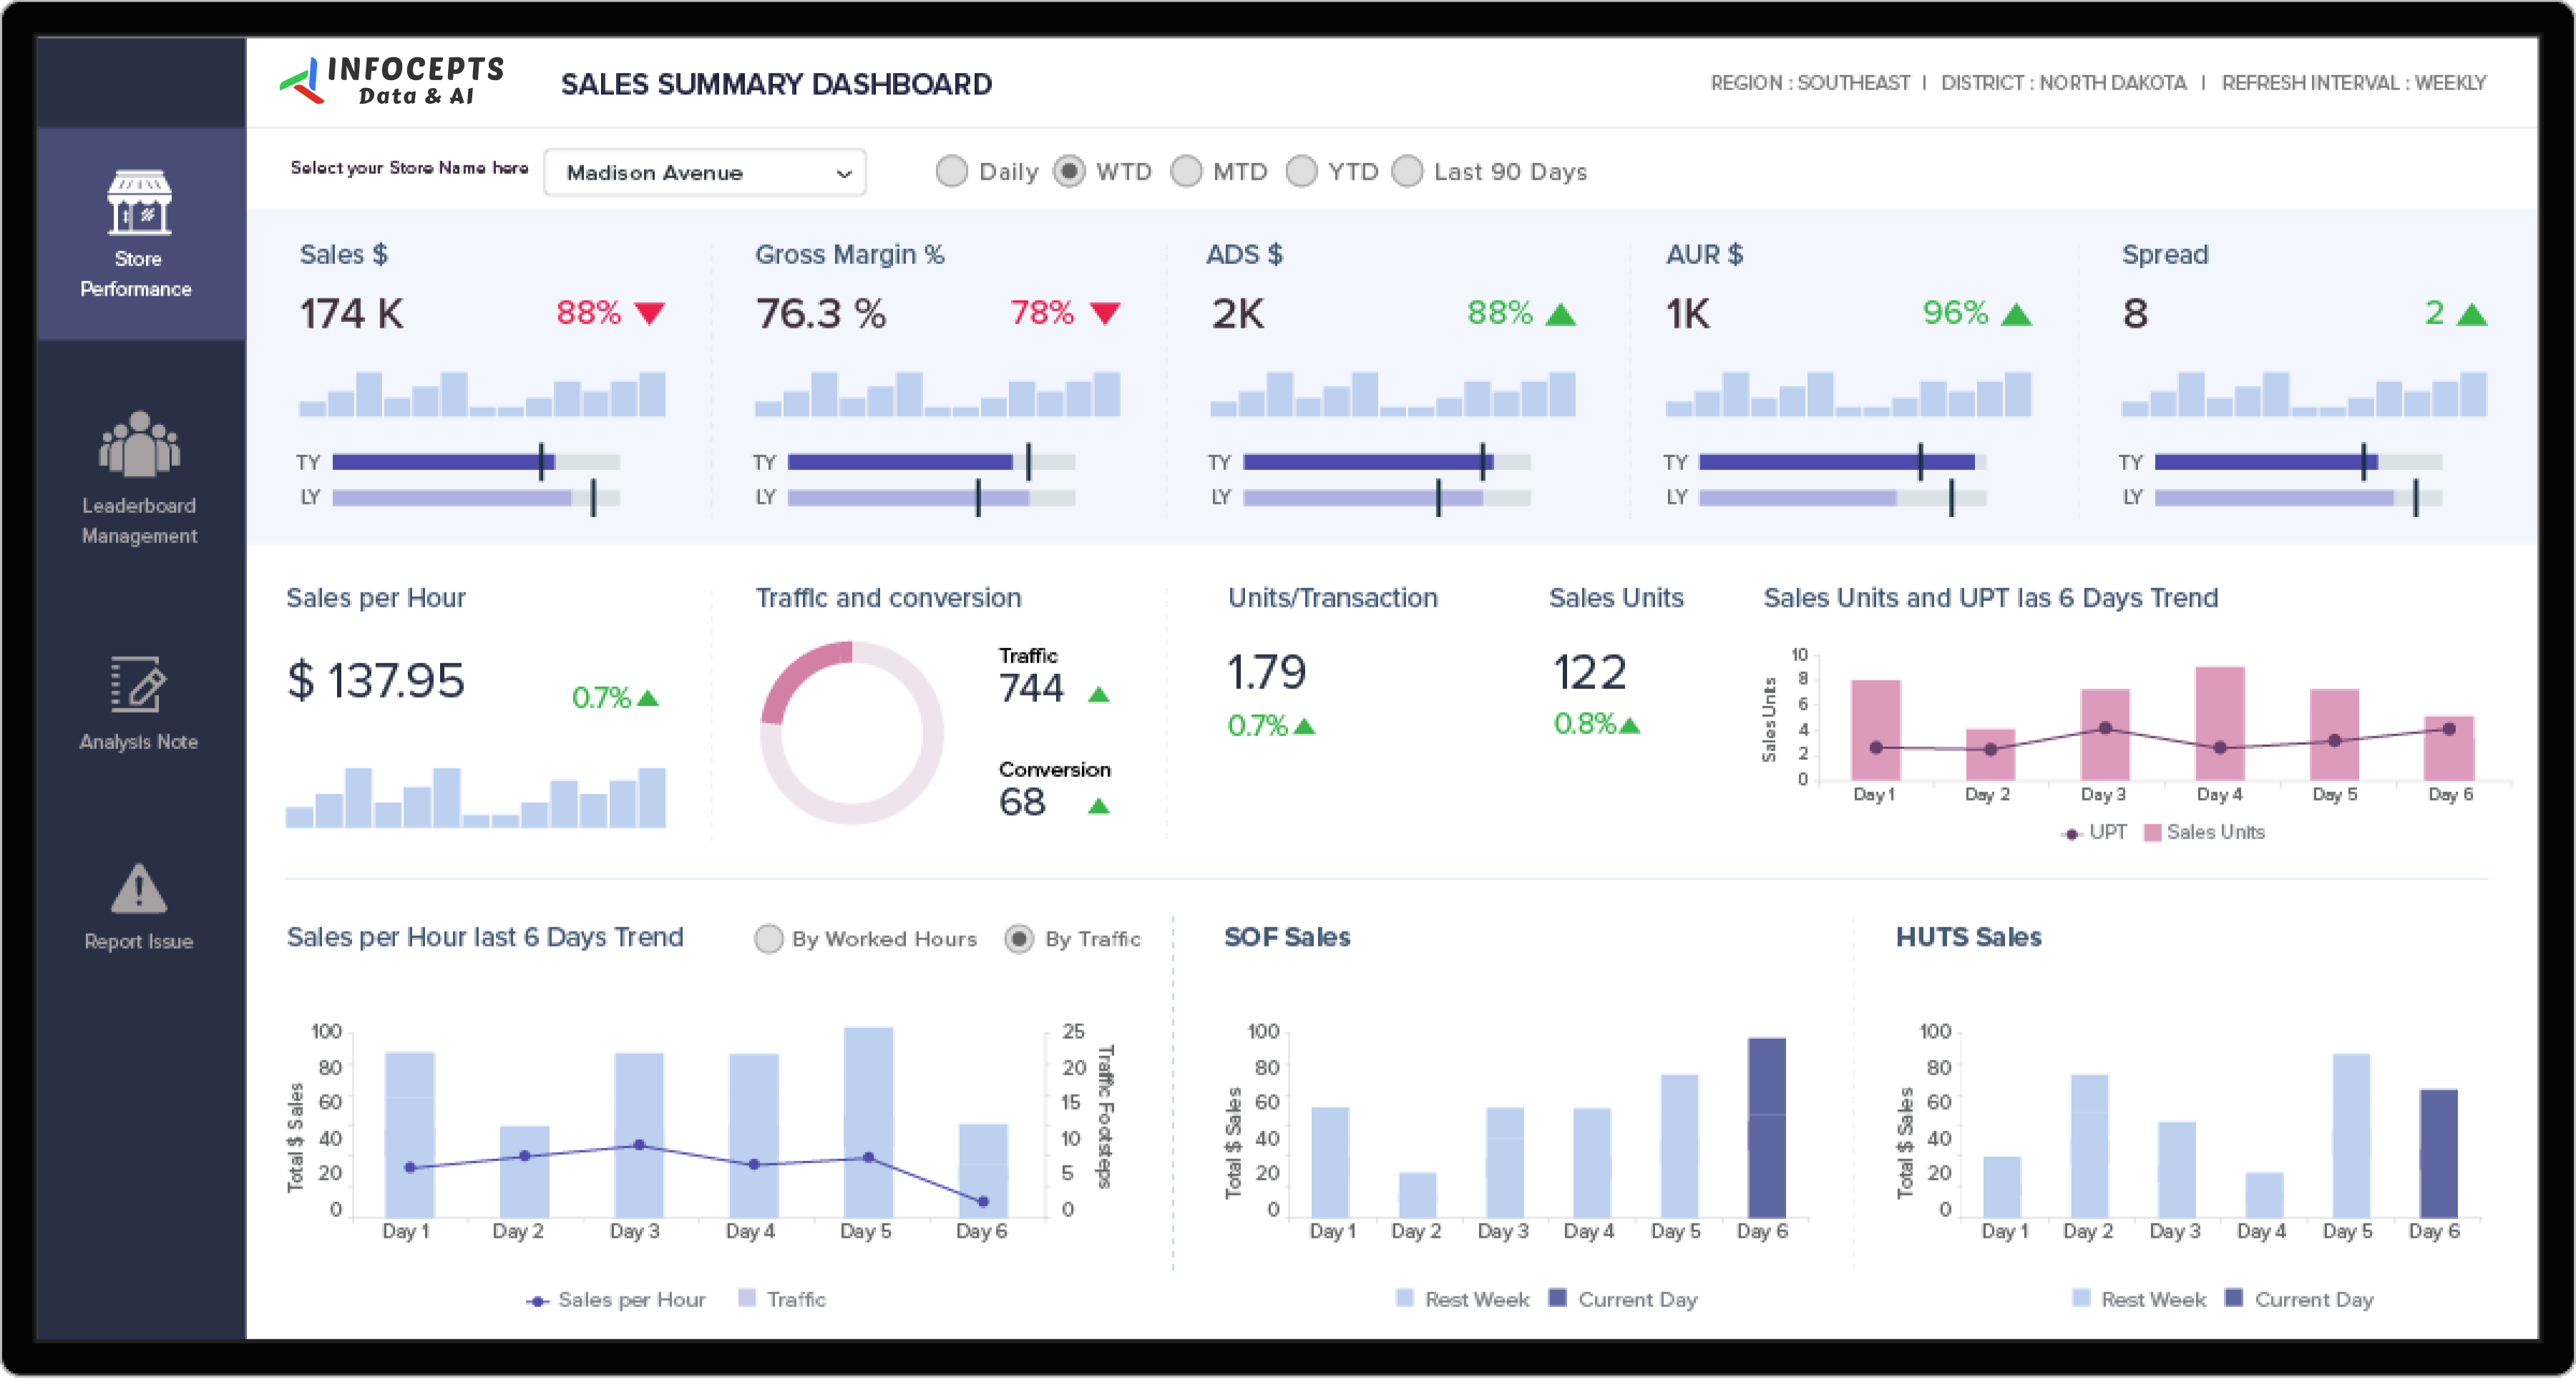
This retail store analytics dashboard gives retail executives and store managers a real time view of sales trends, rental margins, and operational costs. They use it to make faster decisions on costs, forecasting, and customer retention. Infocepts built it on MicroStrategy, with analytics that update as the business moves.
Infocepts delivered it through business analytics services, using data storytelling and design thinking.
For more from Retail & CPG, see store performance analytics for retail and real time sales tracking.
To bring store analytics to your own retail business, talk to our team.
Frequently asked questions
It brings sales trends, rental margins, and operational costs into one view, so retail executives and store managers can make faster decisions without reconciling separate finance and operations reports.
Rent is often one of the largest fixed costs per store; tracking margin against it directly shows which locations are actually profitable once real estate cost is factored in.
Real time sales and cost data gives forecasting models a more current baseline than periodic reports, improving accuracy for near term planning.
Retail executives and store managers responsible for cost efficiency and location level profitability decisions.
Connecting sales trend data to operational performance highlights where service or experience issues might be affecting repeat business, not just sales volume.
By connecting sales and cost data into a BI platform through Business Analytics services, for Retail & CPG organizations.

 Pranali Lanjewar