


































































55%
Faster Customer Service
30%
Reduction in Cost of Goods Sold
70%
Improvement in Inventory & Waste Management
95%
Increase in Customer Satisfaction
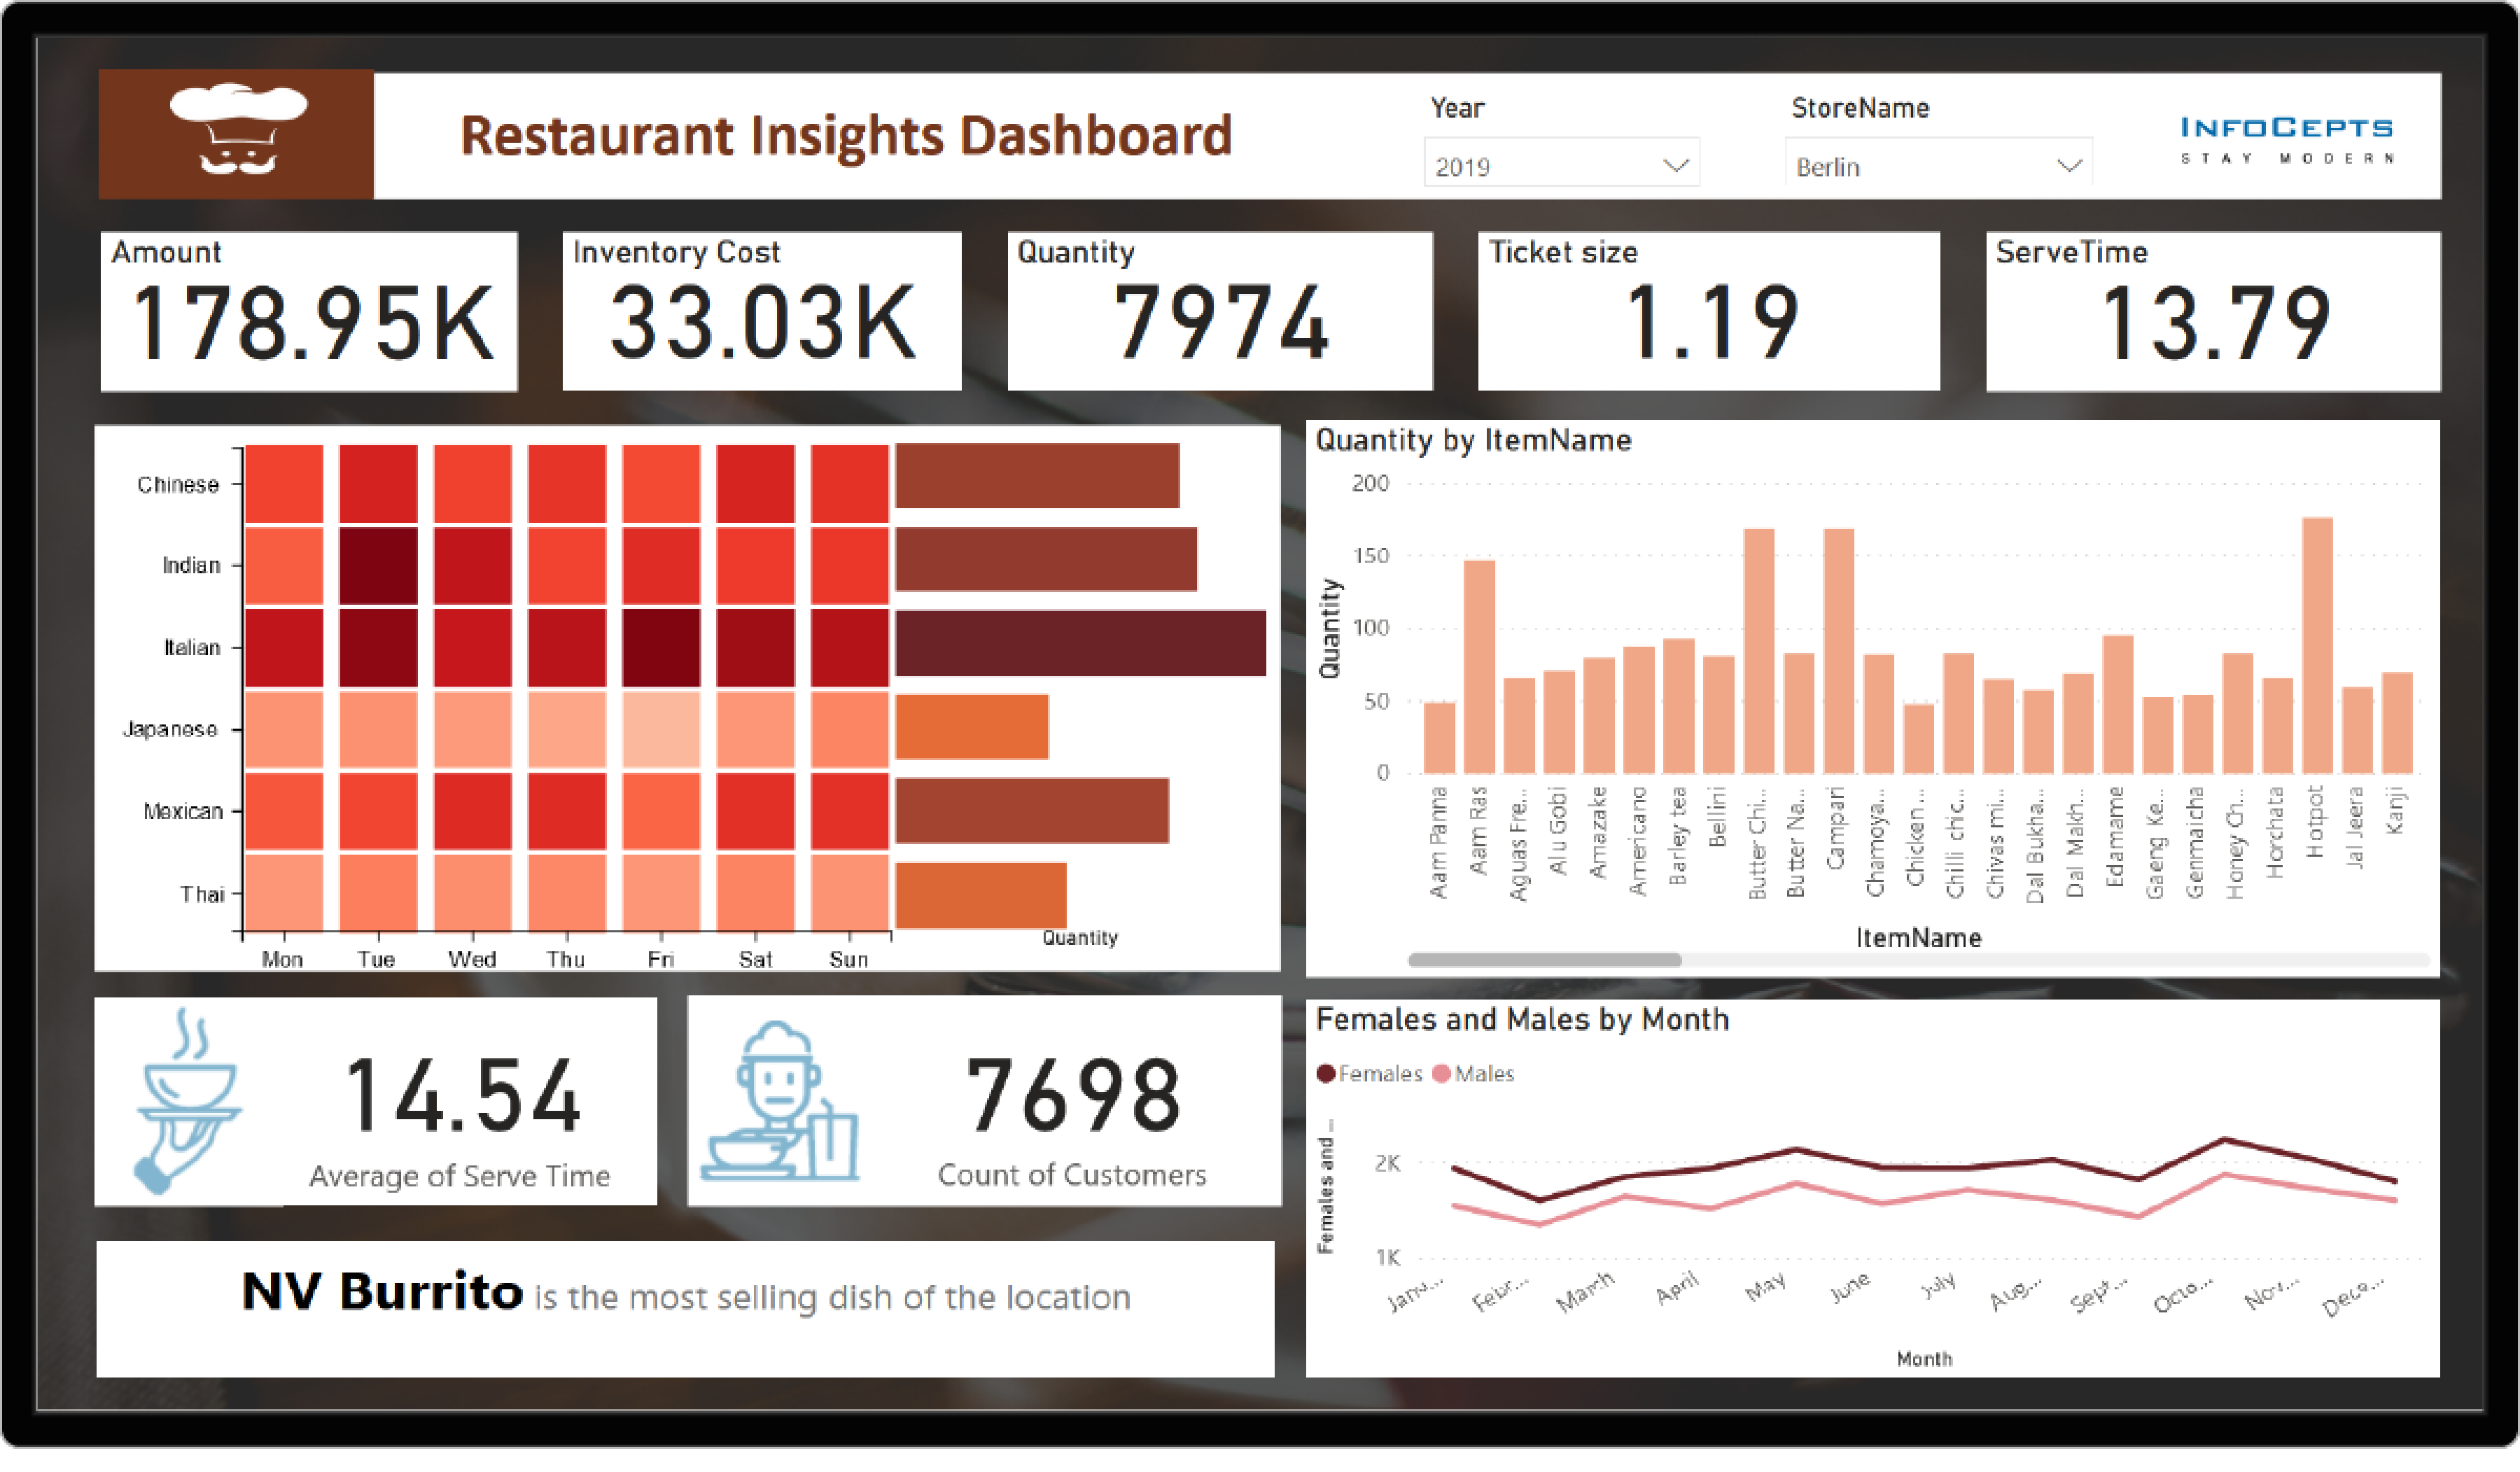
This restaurant analytics dashboard gives restaurant managers one view of staffing, sales, and inventory, alongside customer preferences and feedback. Chefs use its demand predictions for specific dishes and cuisines to prepare the right ingredients, which cuts waste, wait times, and operational inefficiency. Infocepts built it on Microsoft Power BI.
Infocepts delivered it through business analytics services, using data storytelling and design thinking.
For related work, see retail store analytics and smart inventory analytics for retail, or browse our case studies.
To build a restaurant analytics dashboard for your own operation, talk to our team.
Frequently asked questions
It brings staffing, sales, and inventory data together with customer preferences and feedback, so restaurant managers see operations and satisfaction in one place instead of separate systems.
Forecasting demand for specific dishes lets chefs prepare ingredient quantities closer to what will actually sell, instead of preparing too much to avoid running out.
Staffing levels and wait times, by matching labor scheduling to predicted demand rather than a fixed schedule regardless of expected volume.
Restaurant managers and operators responsible for day to day decisions on staffing, inventory, and menu performance.
Tracking preferences and feedback alongside sales and inventory shows whether an operational change is also affecting the dining experience, not just the bottom line.
By connecting POS, inventory, and feedback data into a BI platform through Business Analytics services.

 Pranali Lanjewar



