23%
Improvement in Total Revenue by Region
77%
Capture of Regional Sales Target vs. Actual Performance
47%
Reduction in Underperforming Regions
35%
Increase in Customer Acquisition Rate
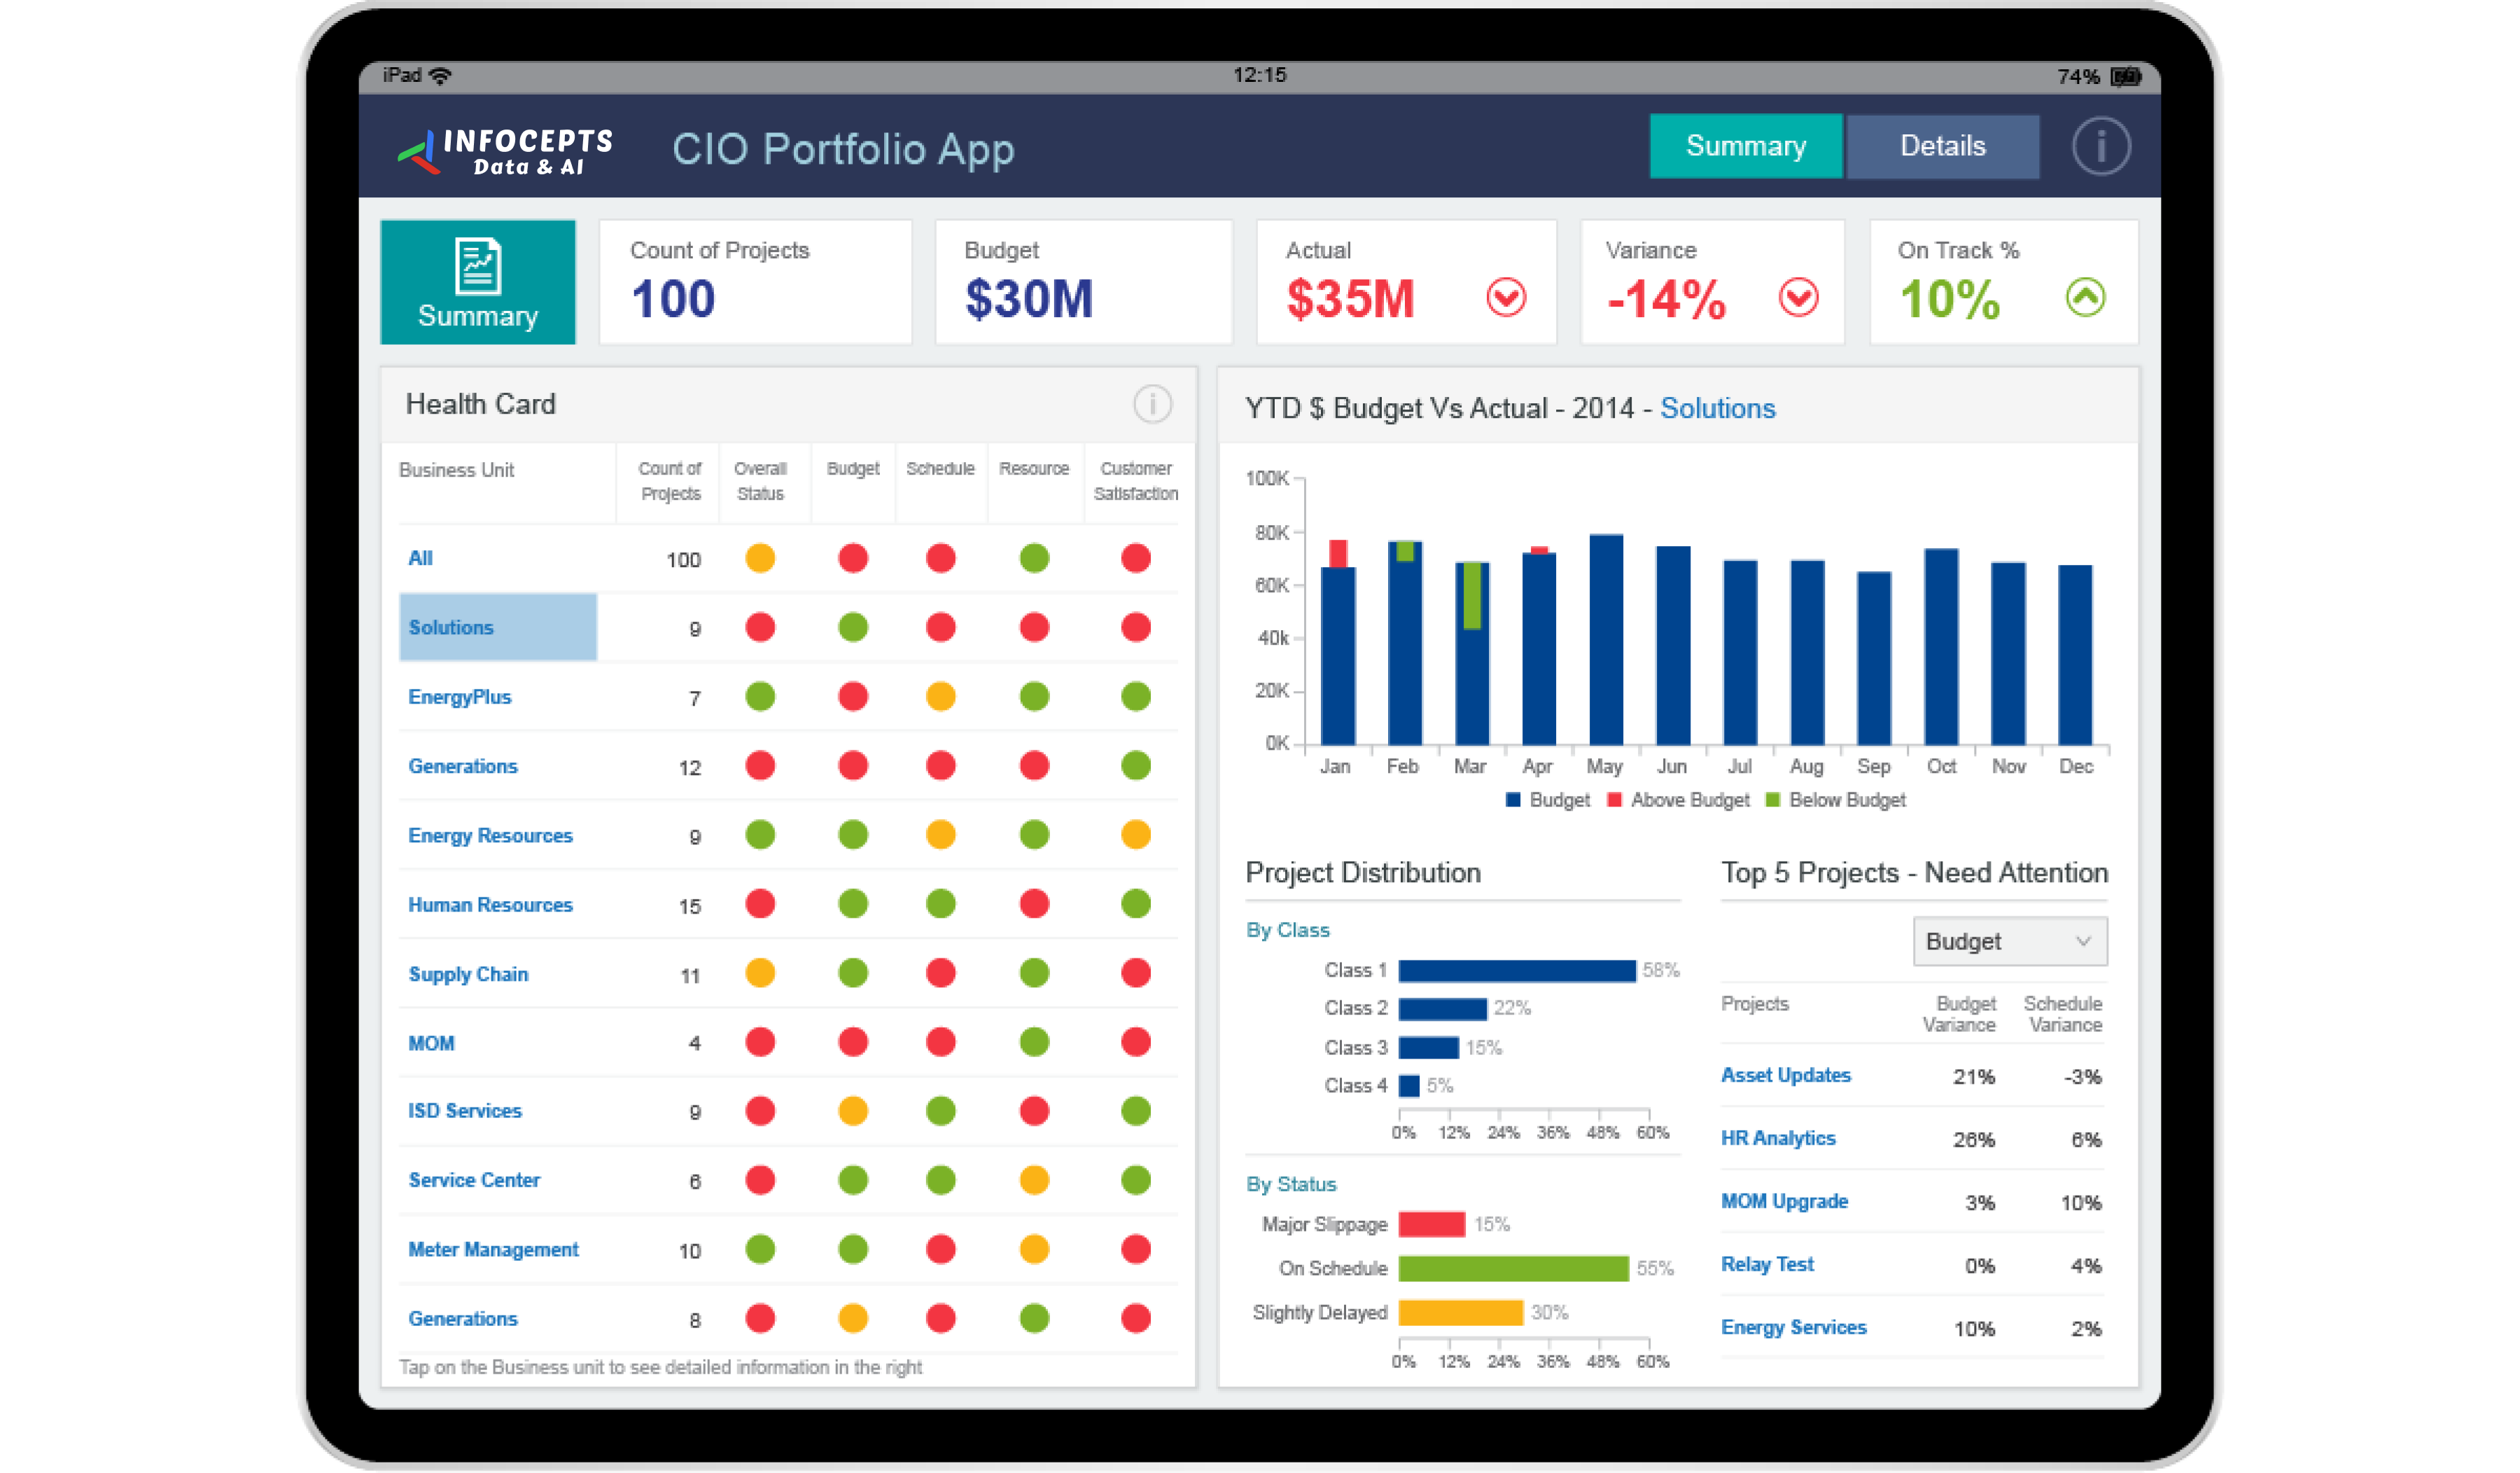
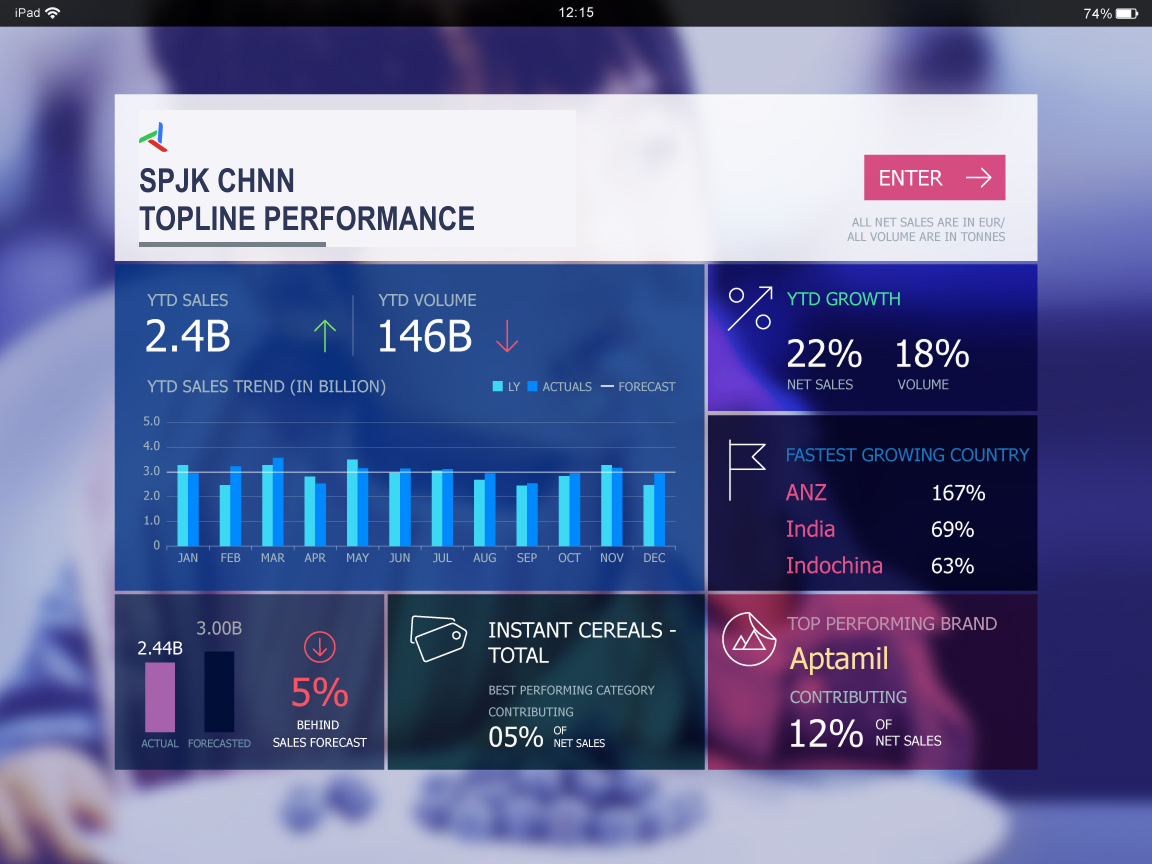
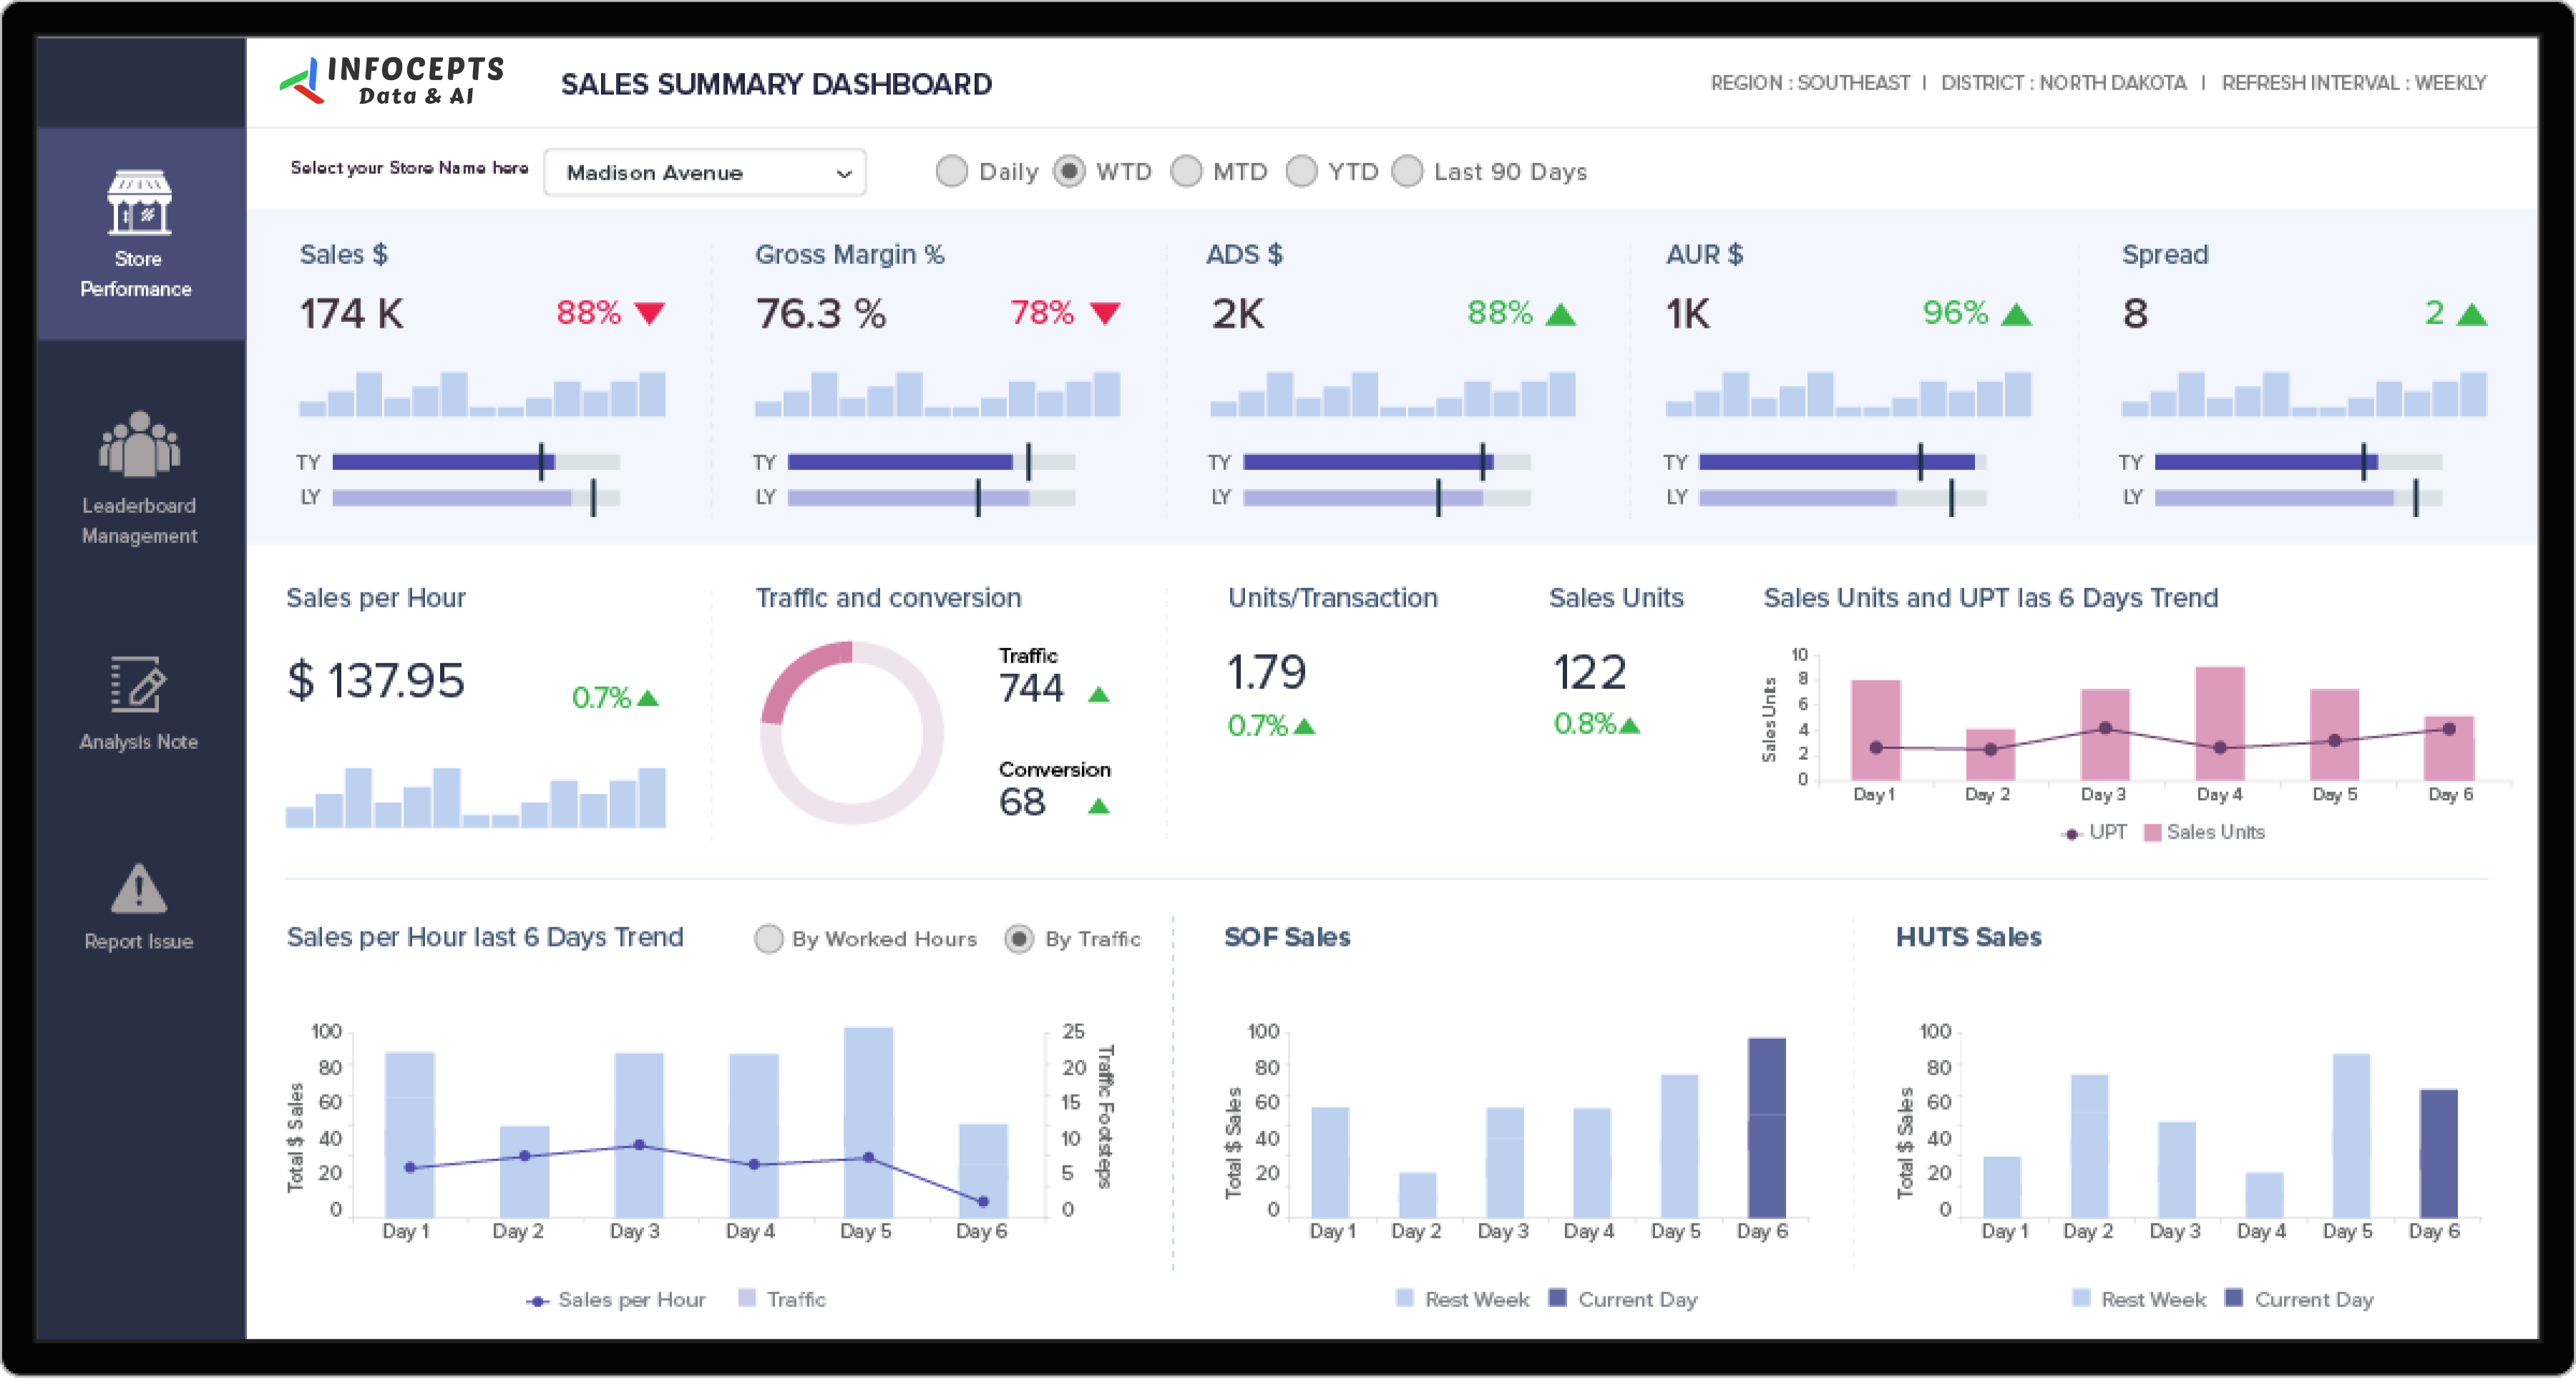
This sales performance dashboard gives sales leaders and regional managers one view of results across geographic regions. It shows regional growth, top performing areas, and sales trends, so teams can decide where to focus and which territories need attention. Infocepts built it on MicroStrategy for multi location organizations.
What problem did this dashboard by Infocepts solve for the multi location sales organization?
Results arrived as separate reports for each territory, which made regions hard to compare and growth hard to trace. Infocepts connected CRM and sales data through data engineering and integration and built one regional view. Leaders now see growth, top areas, and trends side by side instead of piecing them together.
What does the regional sales performance dashboard track?
It tracks regional growth, top performing areas, and sales trends across geographic regions. The layout follows however an organization defines its regions or territories. The dashboard also lists total revenue by region, regional sales target against actual performance, underperforming regions, and customer acquisition rate, so users can compare territories in one place.
Who uses regional sales performance dashboards in Retail & CPG companies and how?
Sales leadership uses them to compare territories and decide where strategy needs to change. Regional managers check how their areas trend against target. Retail & CPG organizations with many locations use them to shift focus toward high growth areas and to spot underperforming territories before they miss a target.
What business impact did the multi location sales organization see after rollout?
Reported results include a 23% improvement in total revenue by region and a 47% reduction in underperforming regions. It also lists 77% capture of regional sales target against actual performance and a 35% increase in customer acquisition rate.
Key metrics: regional growth, top performing areas, sales trends, total revenue by region, sales target against actual, underperforming regions, and customer acquisition rate.
Explore more examples in the Retail & CPG section, see the retail sales analytics dashboard, or try the real time sales tracking dashboard.
Want a sales performance dashboard for your regions? Talk to our team about what to track and how to build it.

 Pranali Lanjewar