


































































47%
Reduction in Incident Response Time with Real-Time Alerts
42%
Improvement in Server Uptime via Proactive Monitoring
51%
Enhancement in Issue Resolution Efficiency with Smart Notifications
38%
Minimization of Operational Disruptions through Centralized Monitoring
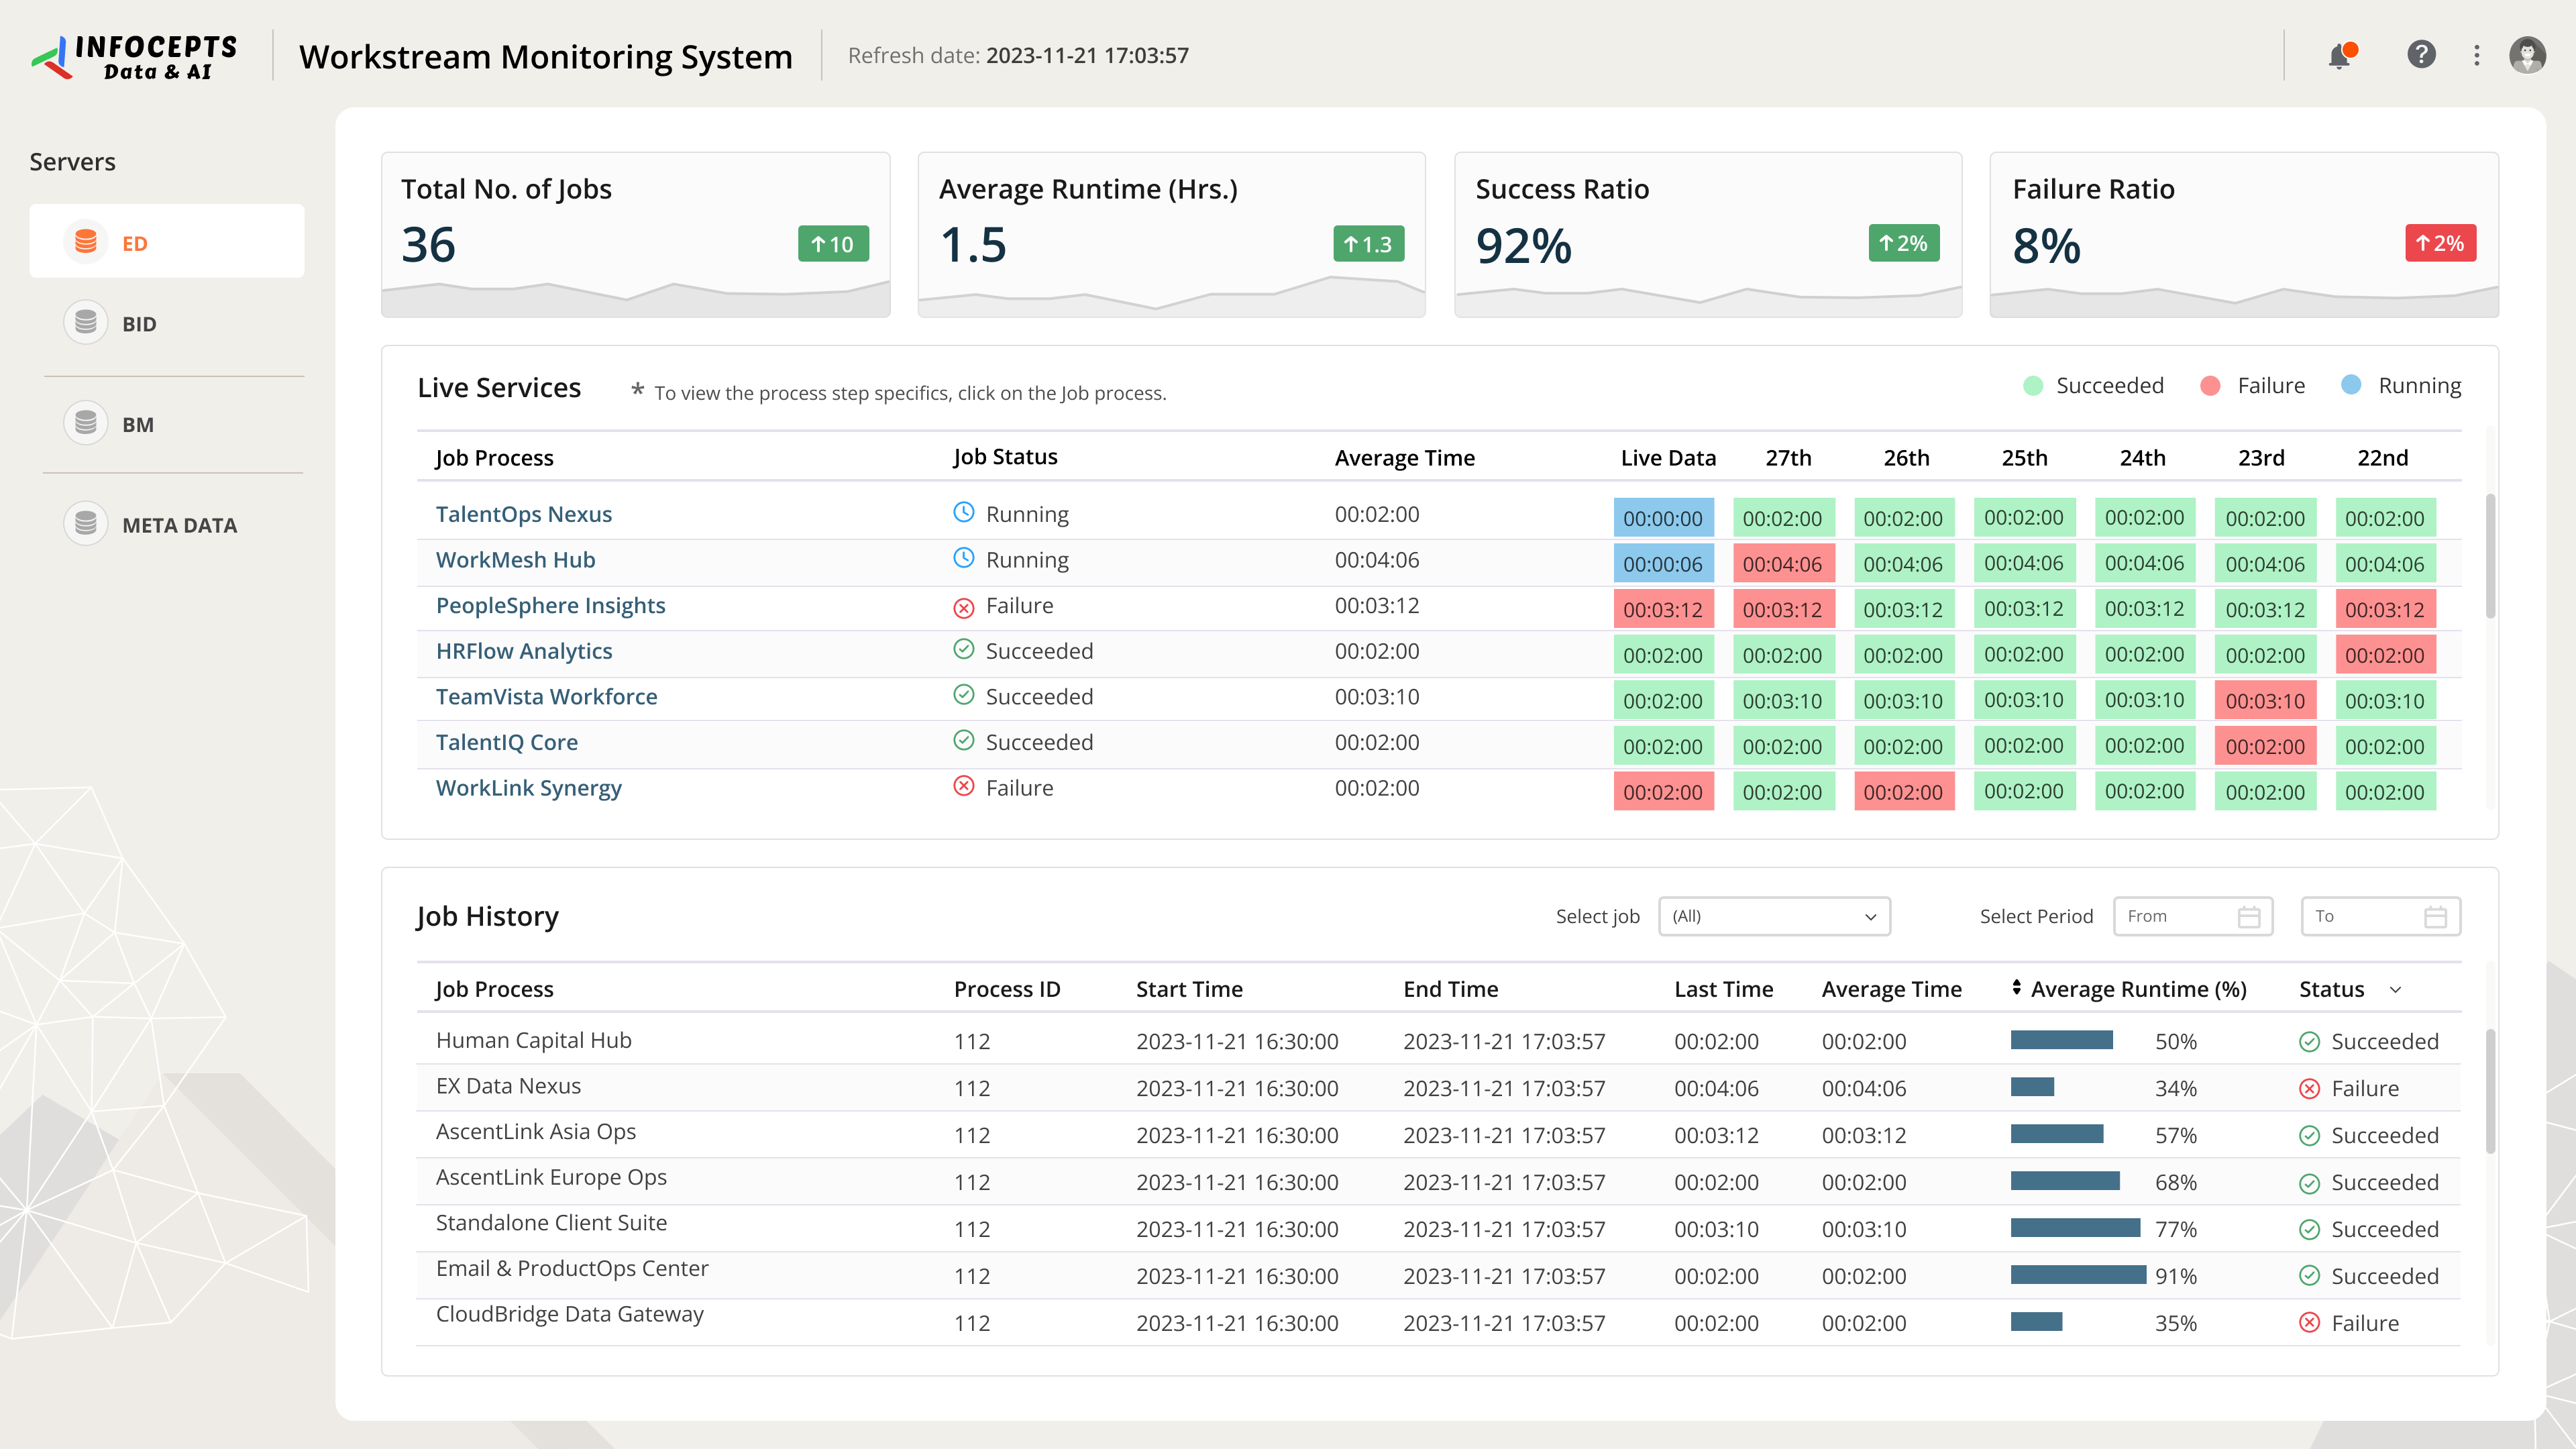
This system health dashboard consolidates server alerts and notifications into one real time view for IT operations teams. They use it to detect issues early, respond promptly, and limit downtime. Infocepts built it on Power BI, with a human centered UI and UX approach that keeps the alerts needing action easy to see.
What problem did this dashboard by Infocepts solve for the IT operations team?
IT teams would otherwise check scattered monitoring tools and inboxes for server alerts. Infocepts built one real time view that gathers alerts and notifications in a single place. Monitoring data comes together through data engineering and integration, and smart notifications flag what needs a response.
What does the systems healthcheck dashboard track?
It tracks server health and alerts in real time. Notifications are designed so the alerts most likely to need action are the easiest to see. Continuous monitoring helps teams spot issues early, respond promptly, and limit downtime. The interface follows how an IT shift works, not just how logs are sorted.
Who uses system health dashboards in IT teams and how?
IT operations and infrastructure teams own uptime across servers and workstreams. On shift, they watch the single view for new alerts and pick the ones that need action first. Team leads use it to judge how quickly the team responds. It sits on top of existing monitoring and alerting tools rather than replacing them.
What business impact did the IT operations team see after rollout?
Reported results include a 47% reduction in incident response time with real time alerts and a 42% improvement in server uptime through proactive monitoring. It also reports 51% better issue resolution efficiency with smart notifications, and a 38% drop in operational disruptions through centralized monitoring.
Key metrics: server alerts, incident response time, server uptime, issue resolution efficiency, and operational disruptions.
See the cloud cost analytics dashboard for another IT operations view, or read our case studies.
Want a system health dashboard for your IT team? Talk to our team about what to track and how to build it.

 Pranali Lanjewar



