92%
Reduced time to insight
62%
Reduced maintenance and cost efforts
92%
Precision in comparative analysis
98%
Data security at all levels
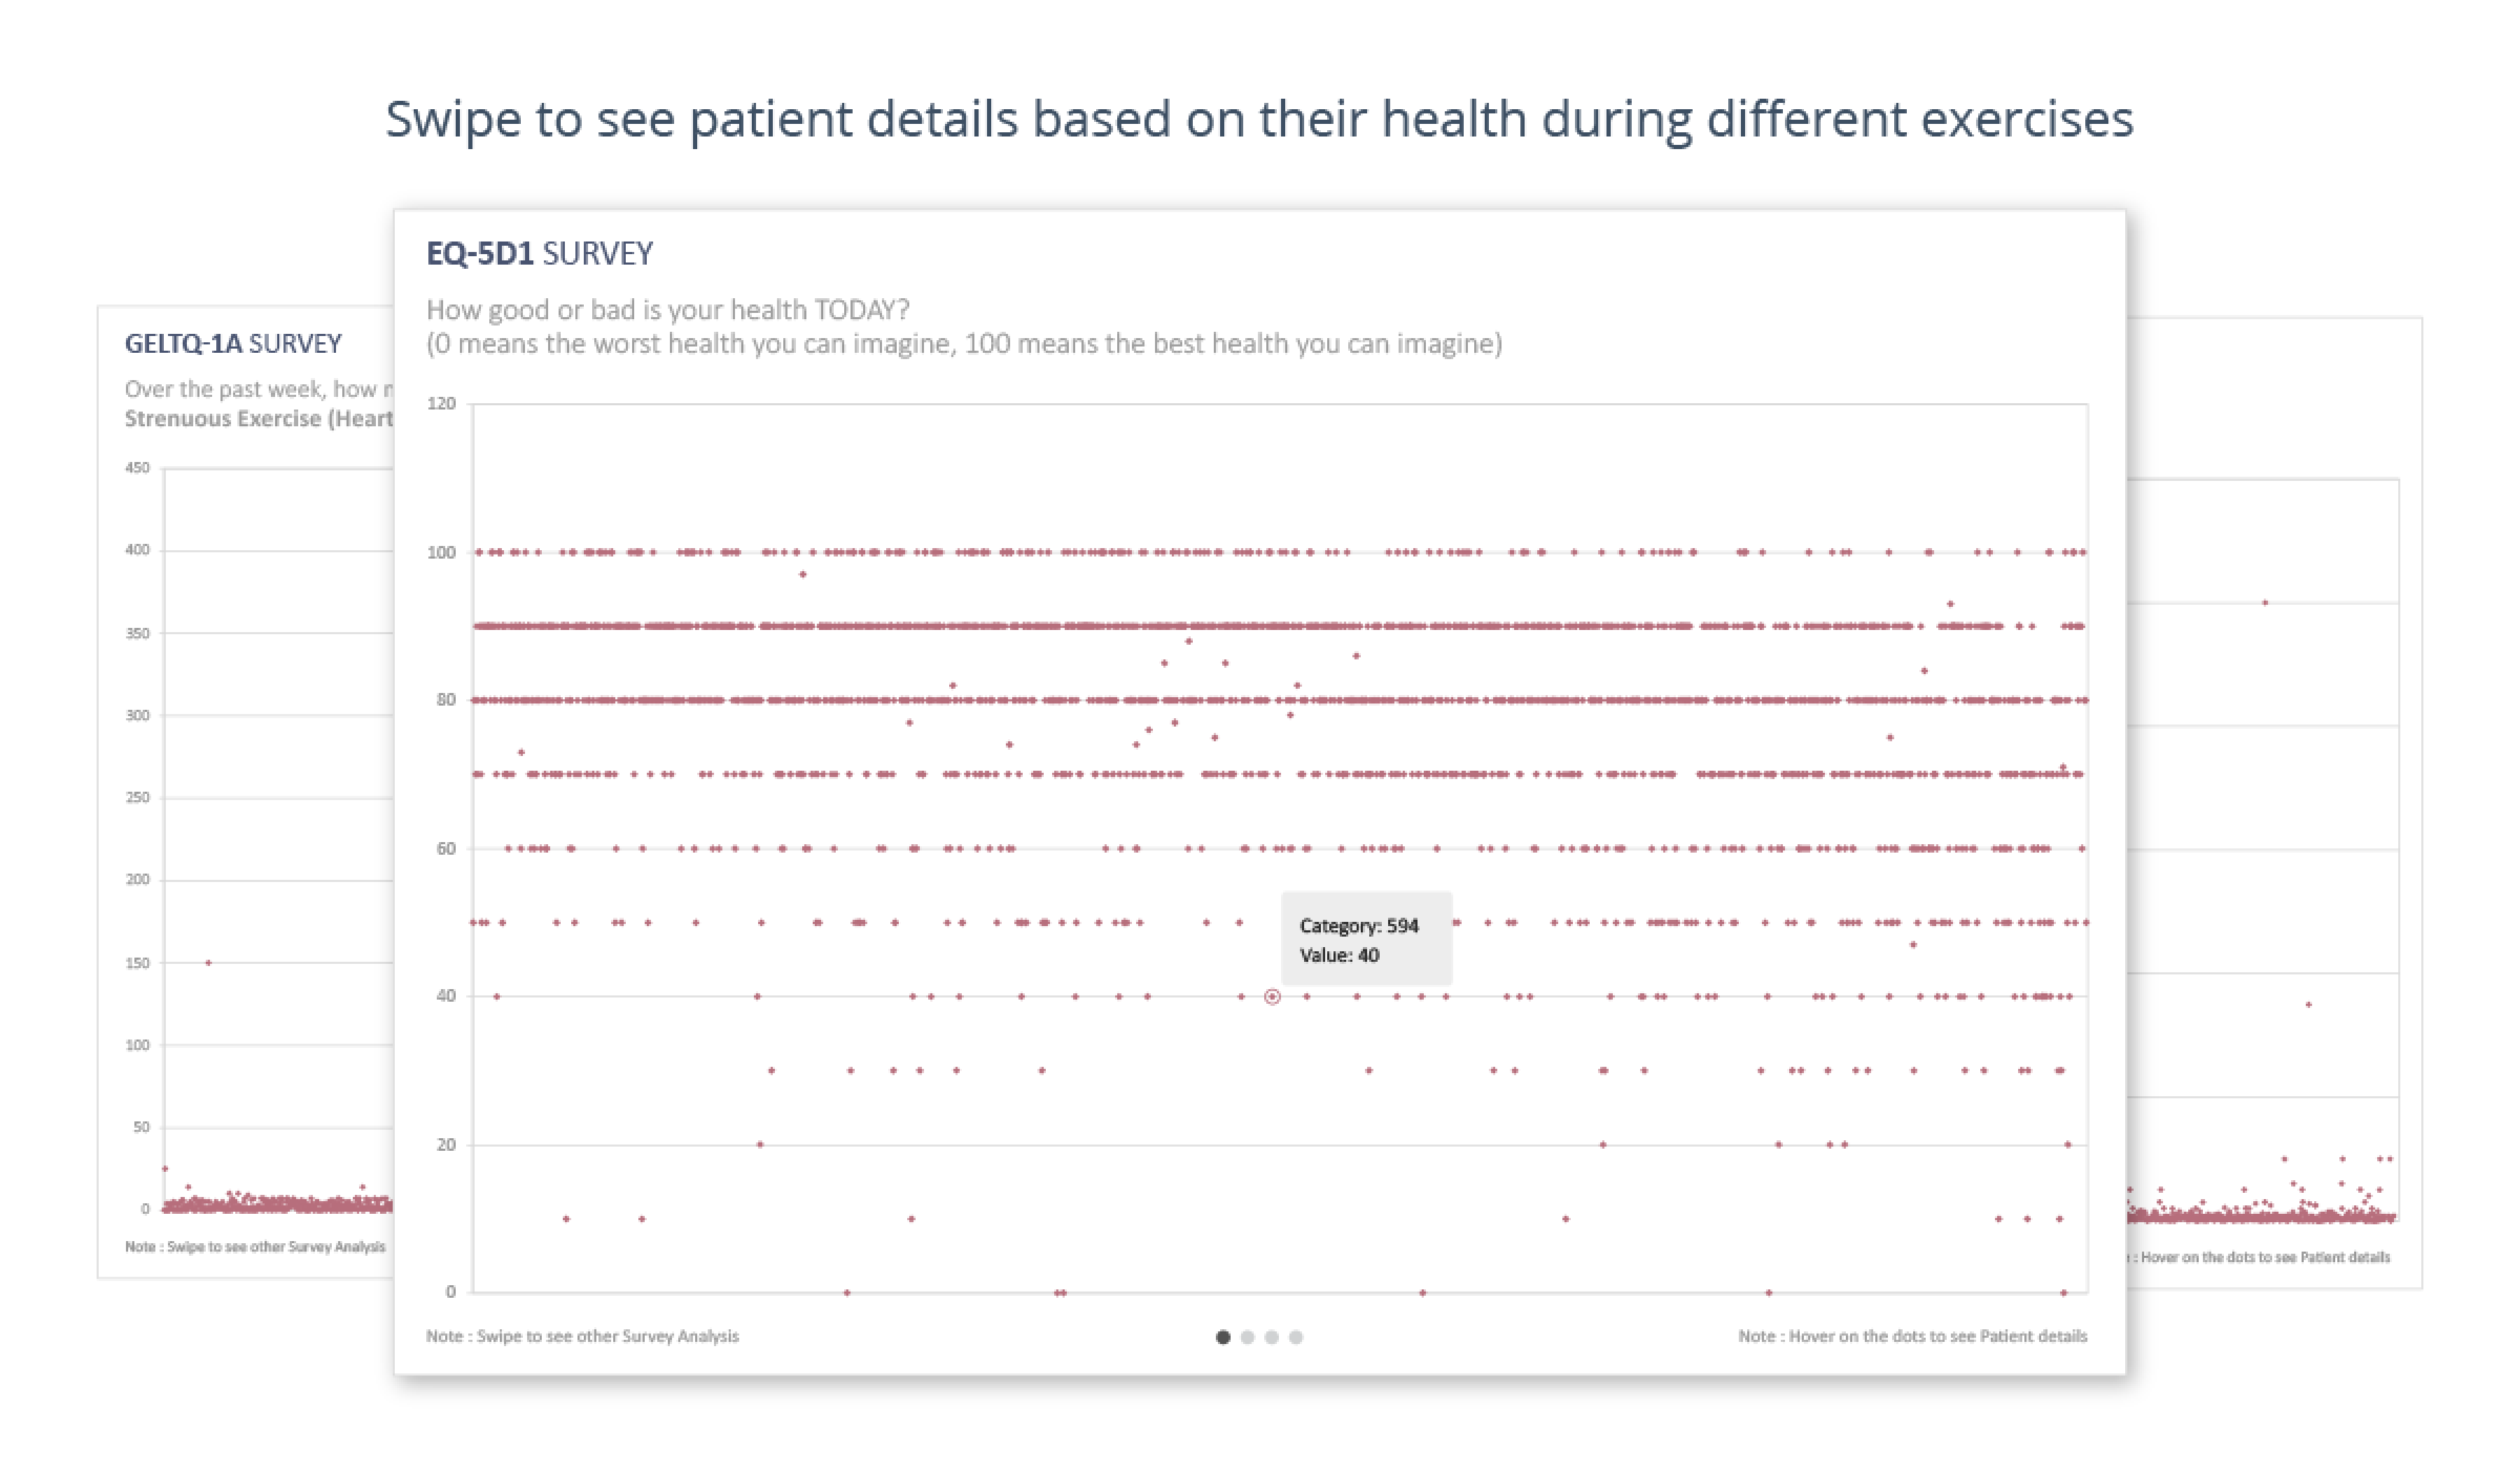
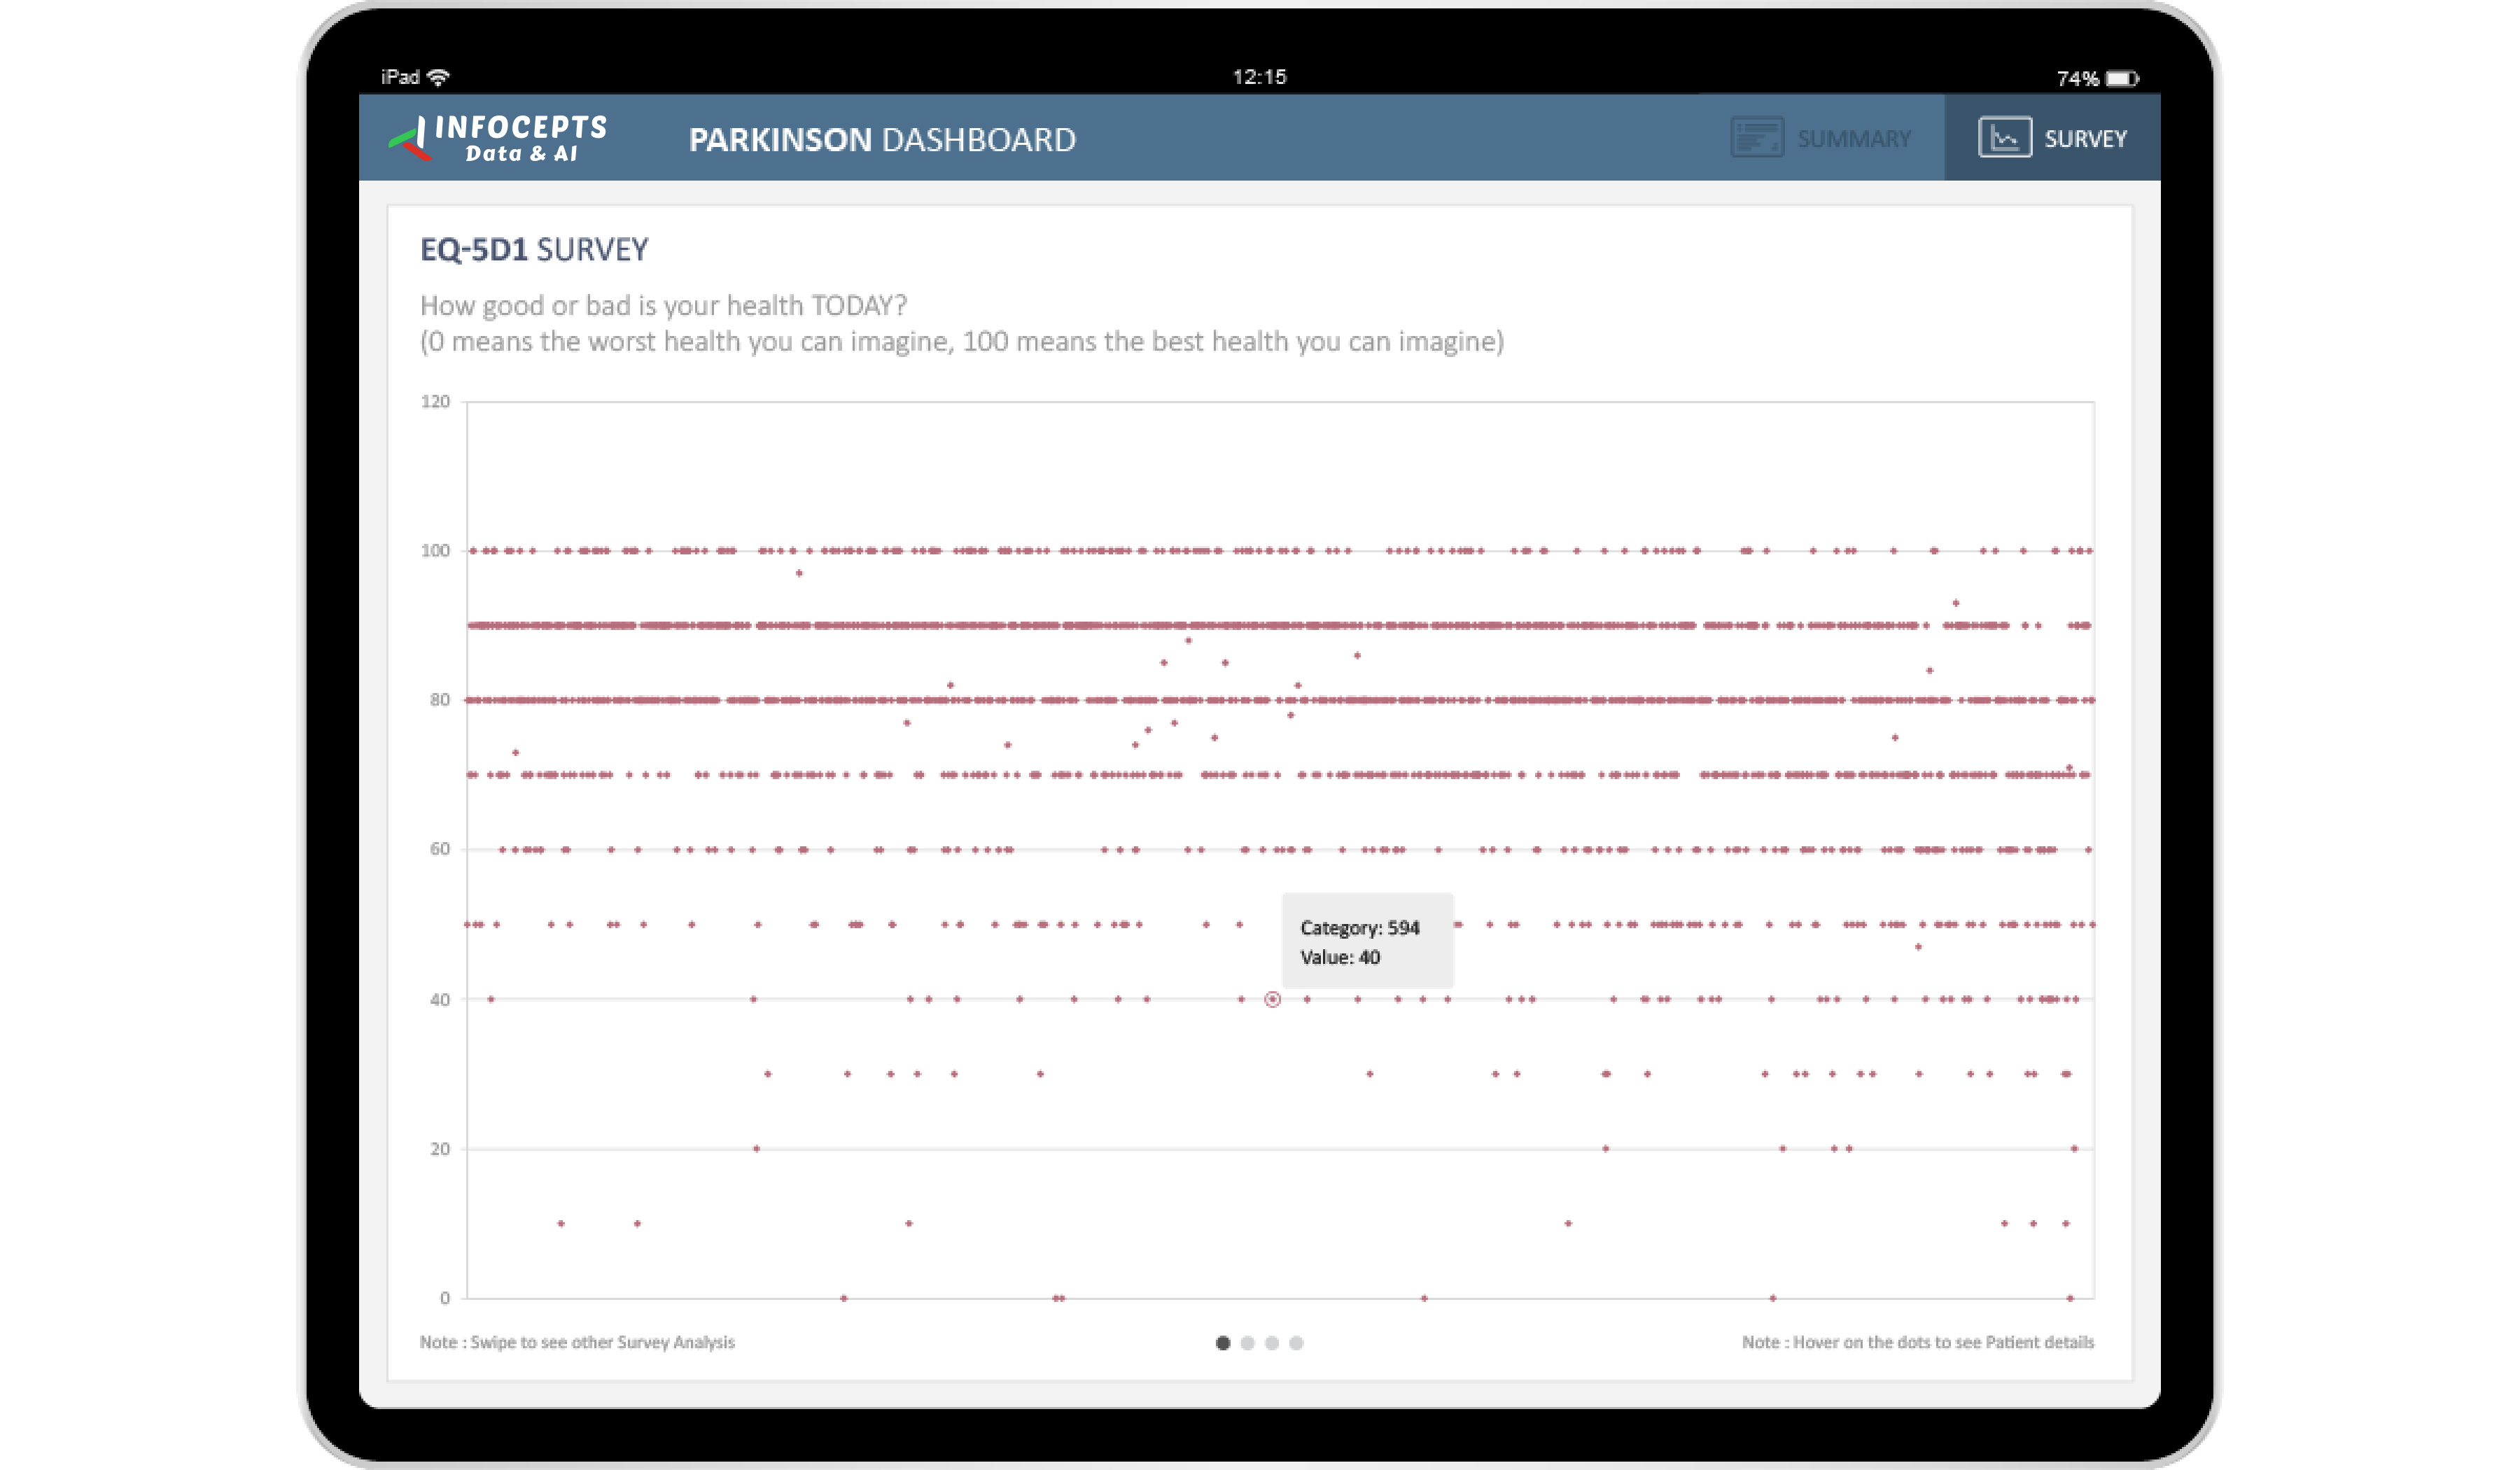
This patient monitoring dashboard gives healthcare professionals a real time view of Parkinson’s progression indicators drawn from survey results. Teams use it to compare results and shorten the time it takes to review data. Infocepts built it on MicroStrategy.
Infocepts shaped the views through data product design, using data storytelling and design thinking.
See more in the Life Sciences section, including healthcare performance analytics and patient relationship analytics.
Planning a monitoring dashboard for your organization? Talk to our team about what to track and how to build it.
Frequently asked questions
It tracks key clinical indicators, such as UPDRS and PDQ-8 survey results for Parkinson’s progression, in real time, so healthcare professionals see changes as they happen rather than at scheduled assessment intervals.
Standard clinical scales used to assess Parkinson’s disease severity and quality of life; tracking them over time in one dashboard makes progression visible instead of comparing separate assessment reports.
Seeing an individual patient’s progression trend, rather than a single point in time score, helps clinicians adjust treatment to how that specific patient is actually responding.
Clinical data that previously took much longer to compile and interpret is available near instantly, so assessment decisions are not delayed waiting on data processing.
The dashboard is built with data security as a core requirement, appropriate for the sensitivity of ongoing clinical monitoring data.
By structuring clinical assessment data into a secure BI platform through Business Analytics services, drawing on Life Sciences industry work.

 Pranali Lanjewar