47%
Reduced maintenance costs
56%
Increased productivity
33%
Reduced annual operation cost
62%
Reduced utility costs
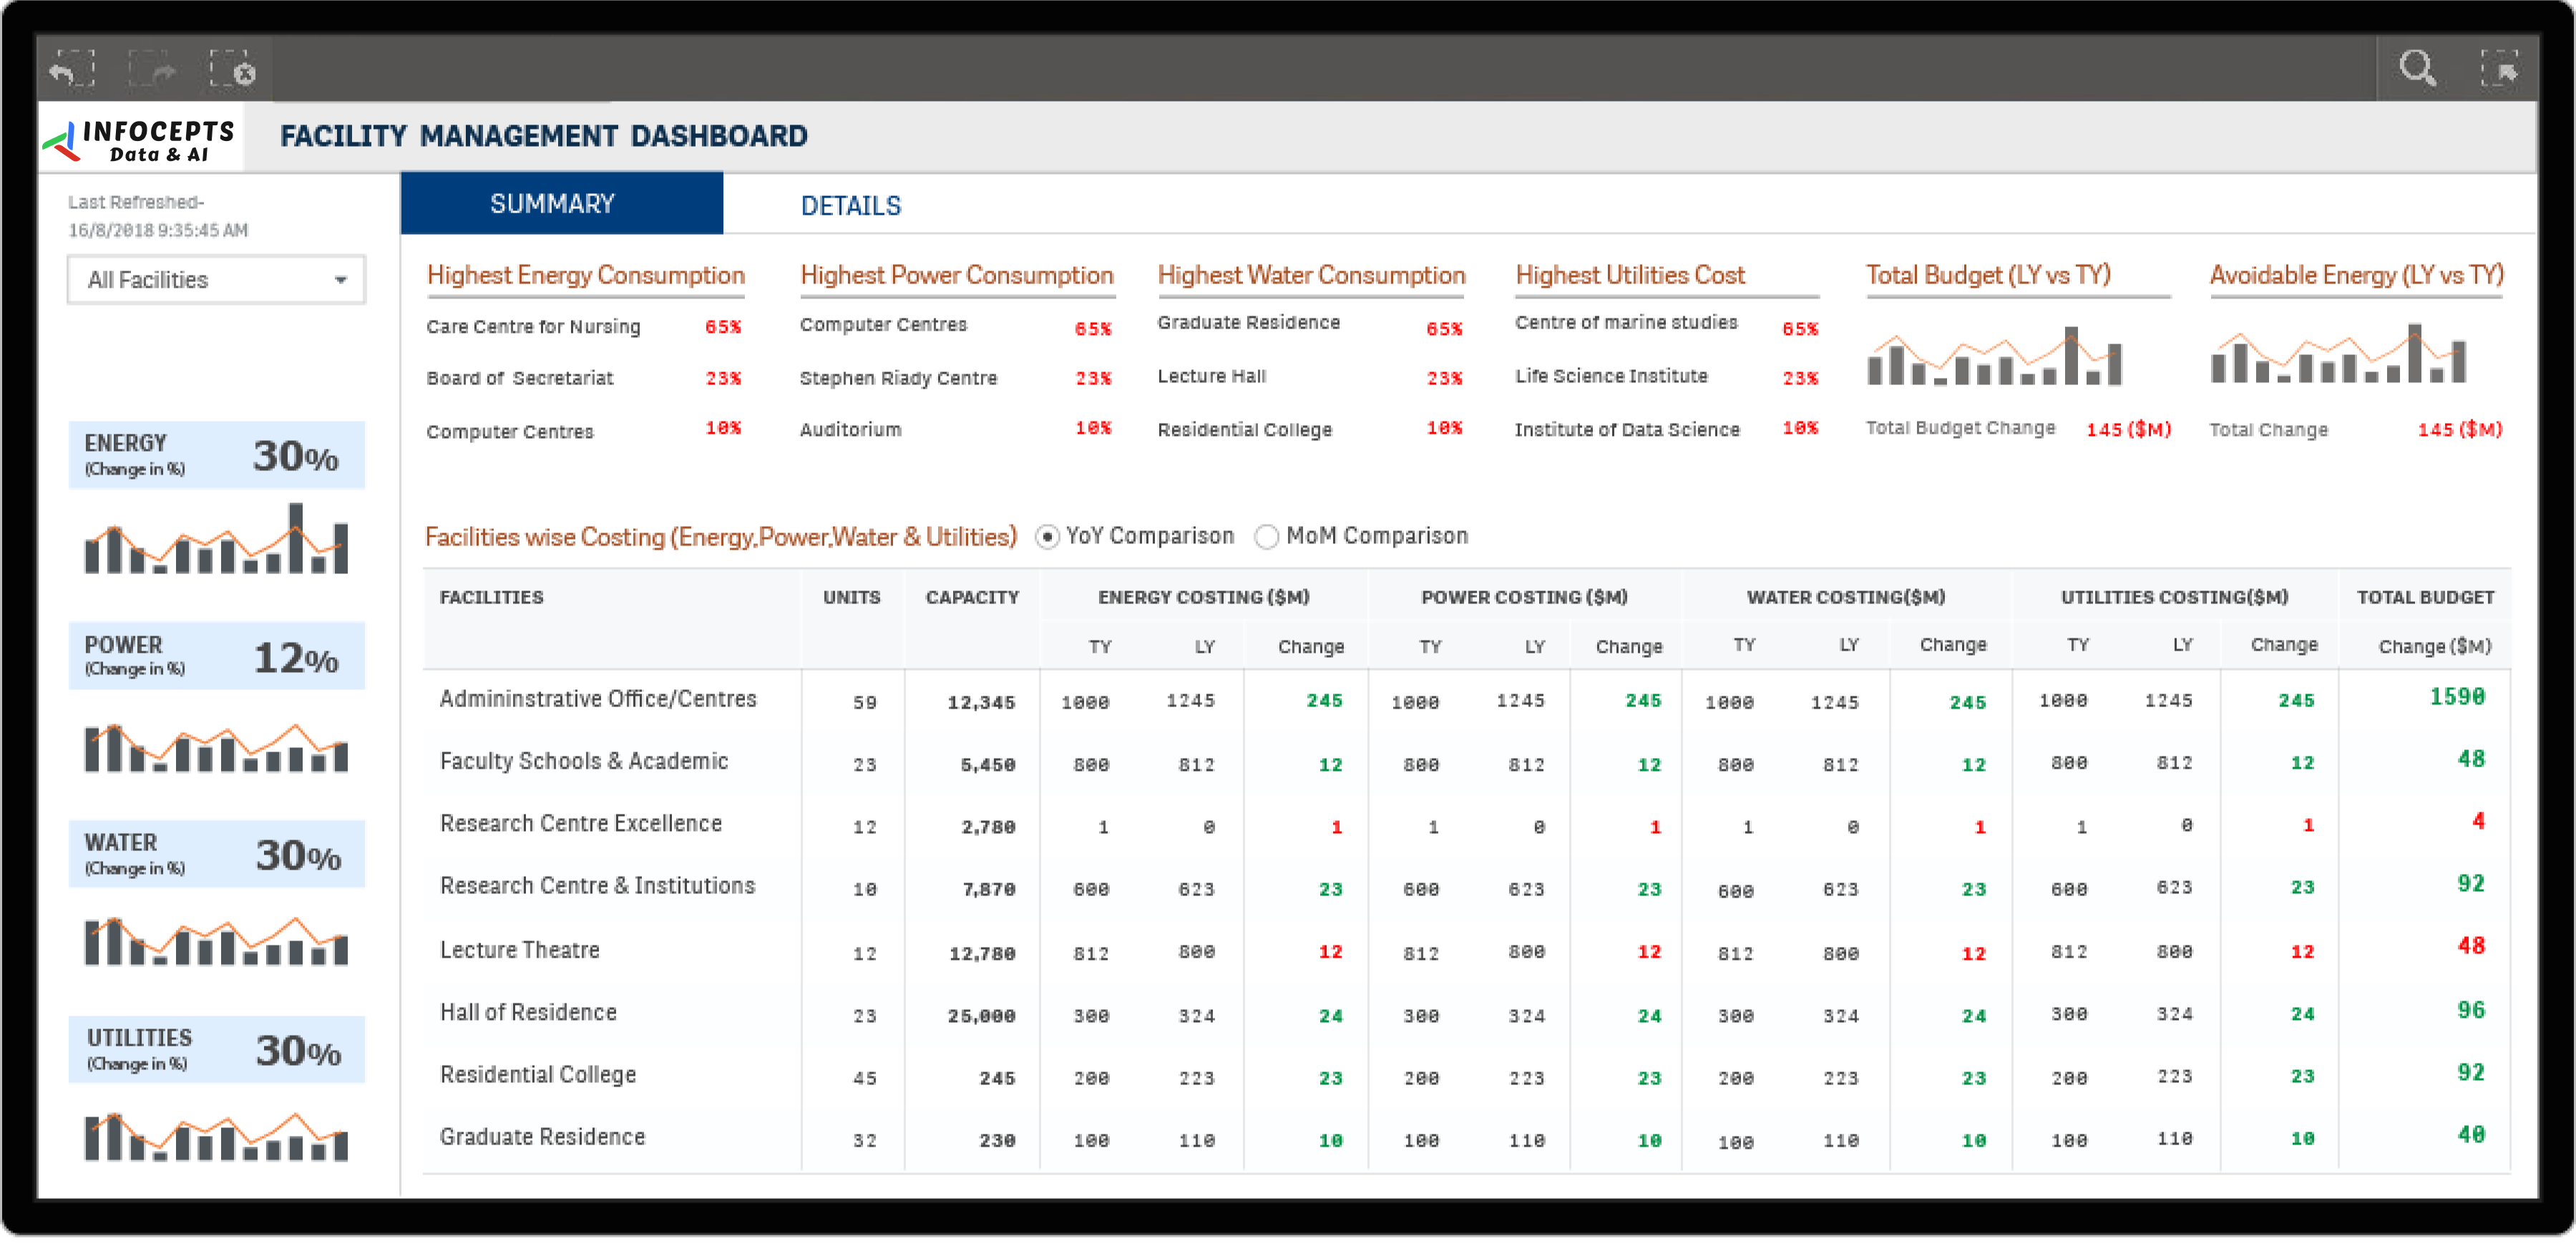
The facility management dashboard gives university administrators a 360 degree view of facility performance. It tracks water, power, utilities, and energy consumption across multiple facilities, with cost trends and comparisons over time. Administrators use it to control costs and use resources efficiently. Infocepts built it on Qlik.
Pulling facility data into one place is data engineering and integration work.
For a related example, see the learning performance analytics dashboard for educational institutes, or read our case studies.
Planning a facility management dashboard for your campus? Talk to our team about what to track and how to build it.
Frequently asked questions
It gives administrators a 360-degree view of facilities performance across a campus, consolidating consumption metrics like water, power, utilities, and energy instead of tracking each facility separately.
Comparing cost trends and consumption patterns across facilities and over time surfaces where usage is drifting up before it becomes a large unplanned expense.
A large university’s facilities often report separately by default; consolidating them lets administrators compare performance and spot outliers that a single building view would miss.
University administrators responsible for facilities operations, maintenance budgets, and sustainability reporting.
Tracking facility performance over time helps identify patterns that precede costly repairs, supporting proactive maintenance instead of reactive fixes.
By connecting utility and facilities data into a BI platform through Business Analytics services.

 Pranali Lanjewar