43%
Reduced welfare loss
36%
Reduced public costs associated with child welfare
38%
Reduced school drop-out rates
46%
Substantial economic value
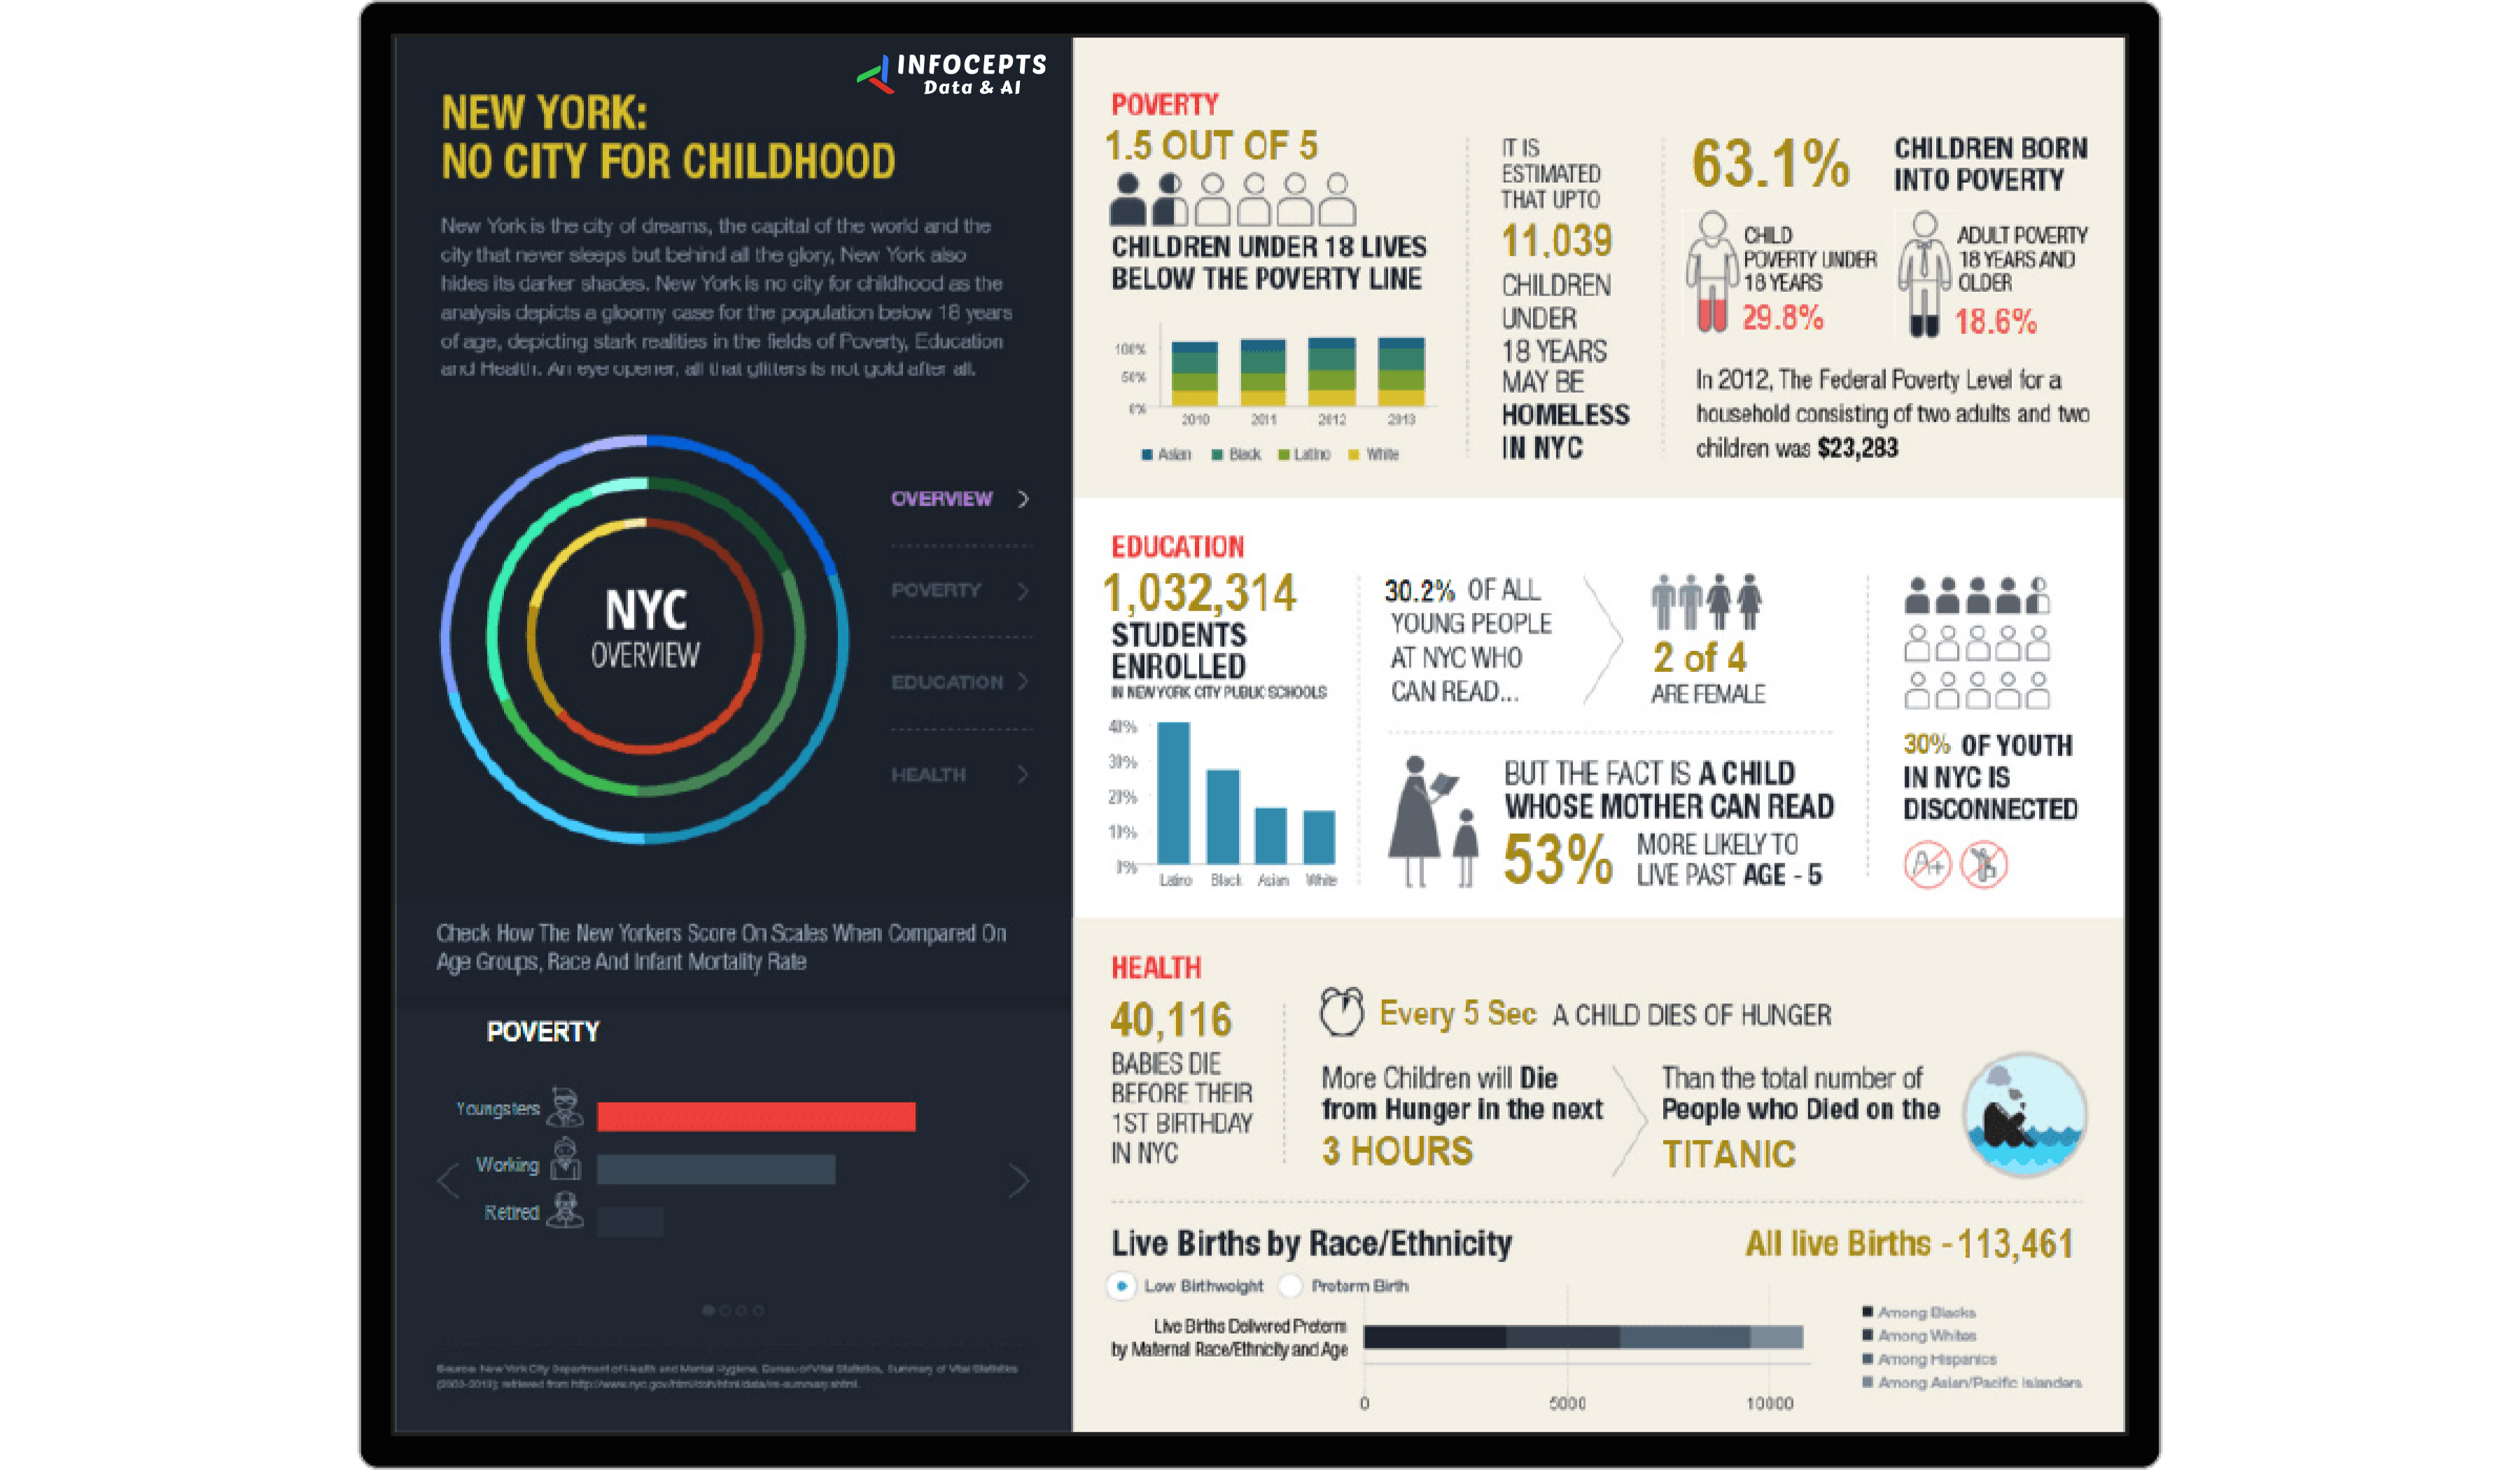
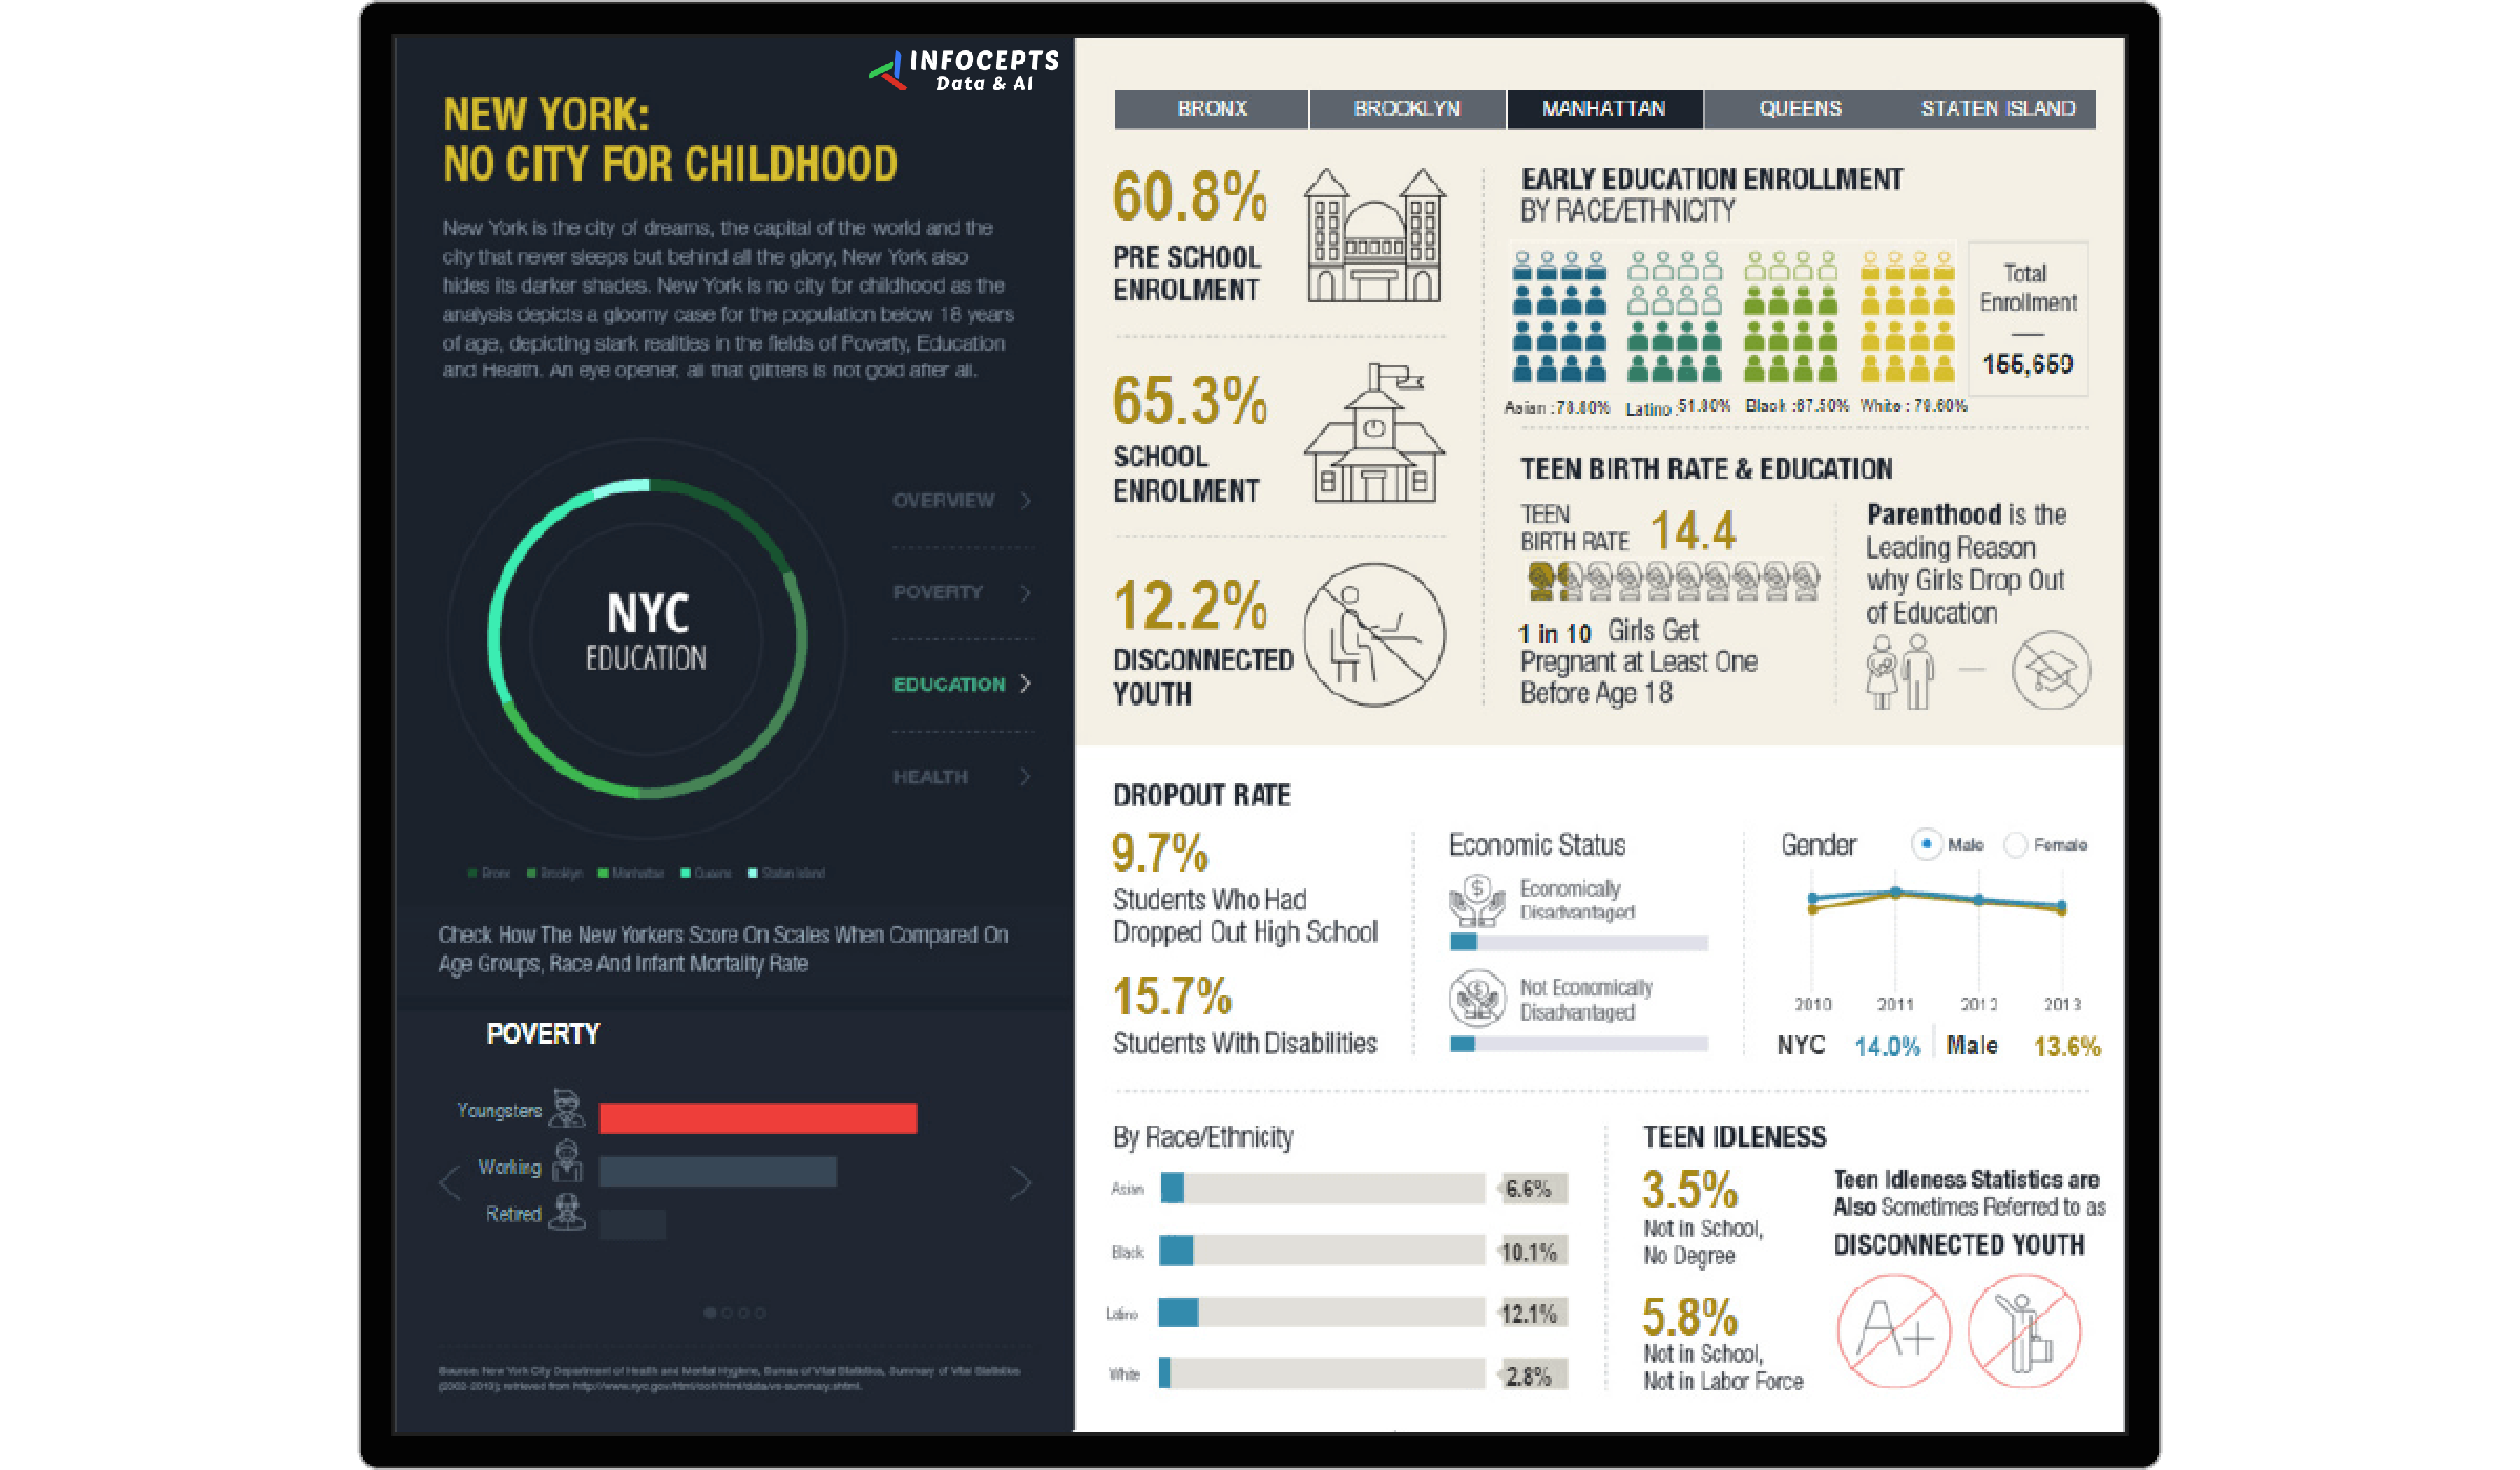
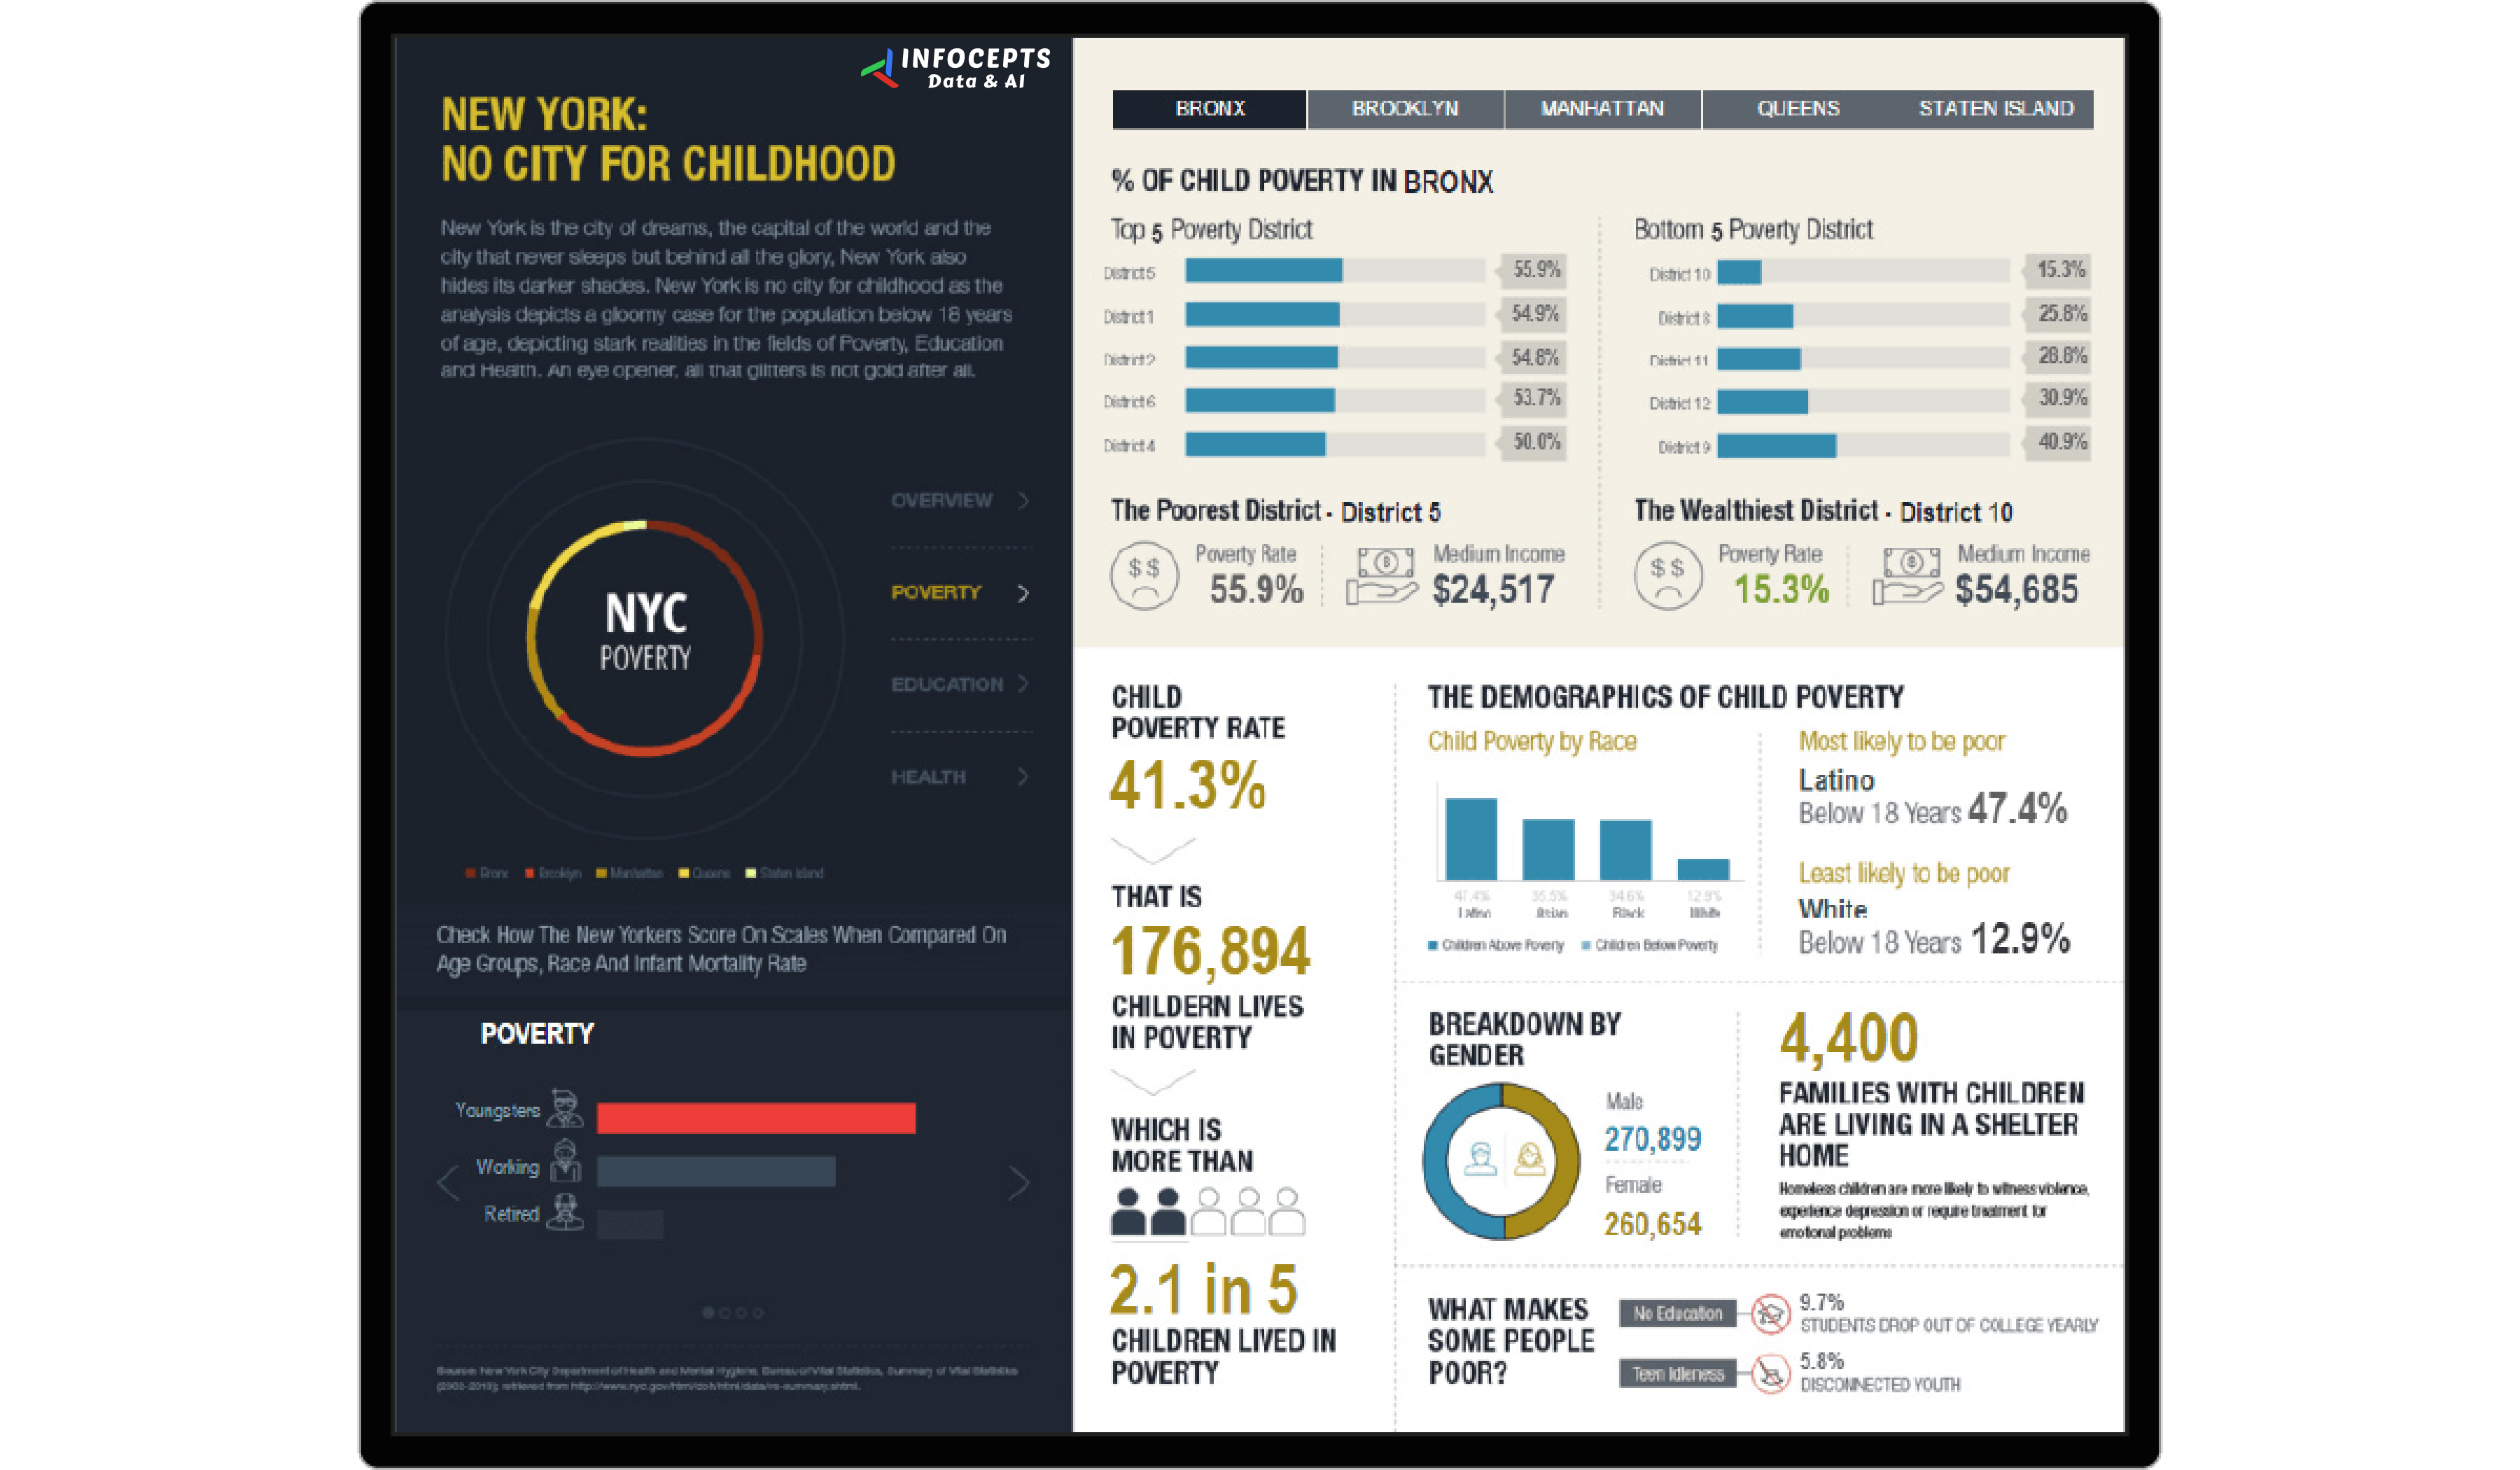
The early childhood welfare dashboard brings health, education, and welfare data for New York City’s youngest children into one view. Policymakers, health professionals, and educators use it to decide where to act to reduce welfare loss. Infocepts built it on Qlik, with interactive views designed for those users.
Infocepts built it through Business Analytics work, using data storytelling and design thinking to shape how the views read.
See more in the Life Sciences section, including the healthcare performance analytics and patient relationship analytics dashboards.
Planning a dashboard for your agency or program? Talk to our team about what to track and how to build it.
Frequently asked questions
It brings health, education, and welfare data for young children into one view, so policymakers and health professionals can see conditions across a city or region instead of reviewing separate agency reports.
Policymakers, health professionals, and educators responsible for child welfare policy and program decisions.
Surfacing where conditions are declining lets agencies act earlier with targeted programs, rather than discovering a gap after it has already widened.
Health records, education enrollment and attendance data, and welfare program participation, brought together instead of tracked in separate agency systems.
Yes. Breaking data down geographically is usually the point, since welfare conditions can vary significantly within the same city.
By connecting data across agencies into a BI platform through Business Analytics services, scoped with Data & AI Strategy work.

 Pranali Lanjewar