


































































20%
Improvement in Fleet Health Score
25%
Increase in Predictive Maintenance Accuracy
10%
Reduction in High-Risk Driver Incidents
18%
Enhancement in Fleet Utilization Efficiency
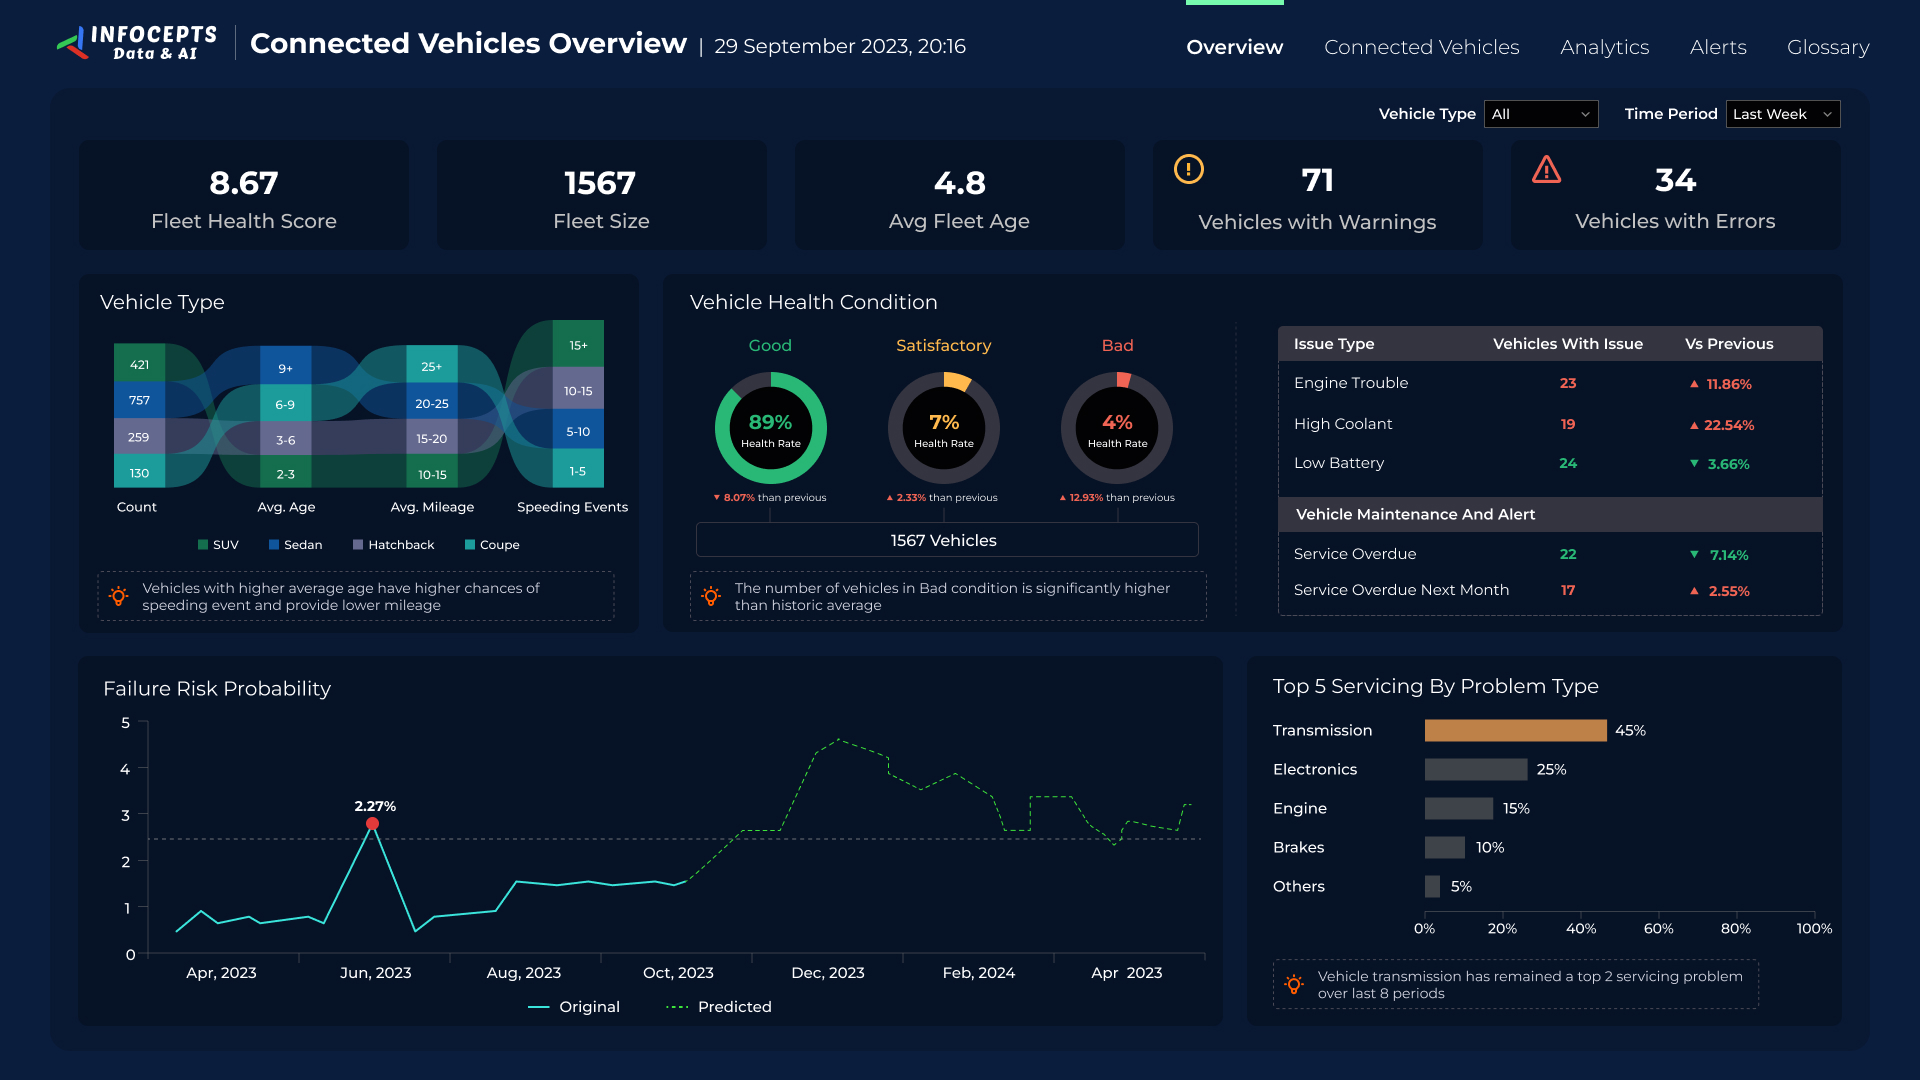
This fleet management analytics dashboard gives fleet operators real time data on vehicle health, maintenance schedules, and operational efficiency. Fleet teams use it to decide which vehicles need attention first and where to cut downtime. Infocepts built it on Power BI with interactive filters, drill down views, and real time alerts.
What problem did this dashboard by Infocepts solve for the fleet operator?
Fleet teams often track vehicle health across separate maintenance logs and spreadsheets. That makes it hard to see which vehicles carry warnings or errors, or to plan work before a failure. Infocepts brought telematics and maintenance data into one view through data engineering and integration, so teams can act early and reduce downtime.
What does the fleet management analytics dashboard track?
It tracks Fleet Health Score, Fleet Size, Average Fleet Age, and vehicles with warnings or errors. It adds predictive maintenance insights, driver profiling, and top servicing issues. Users get real time alerts, interactive filters, and drill down capabilities, all designed for easy navigation.
Who uses fleet management dashboards in logistics and transportation companies and how?
Fleet leaders use the health score to track the fleet over time instead of reviewing every vehicle. Maintenance teams use predictive insights and top servicing issues to plan work before failures. Operators use driver profiling to target coaching where it will reduce cost and risk fastest.
What business impact did the fleet operator see after rollout?
Reported results include a 20% improvement in Fleet Health Score, a 25% increase in predictive maintenance accuracy, a 10% reduction in high risk driver incidents, and an 18% enhancement in fleet utilization efficiency. Together they span vehicle health, maintenance planning, driver risk, and utilization.
Key metrics: Fleet Health Score, Fleet Size, Average Fleet Age, vehicles with warnings or errors, predictive maintenance accuracy, high risk driver incidents, and fleet utilization.
See related transport examples in airline operations analytics and airport performance analytics, or browse our case studies.
Want a fleet dashboard for your vehicles? Talk to our team about what to track and how to build it.

 Pranali Lanjewar



