54%
Boost in sales revenue
23%
Growth in active client base
47%
Increase in advisory fees
71%
Improvement in client engagement
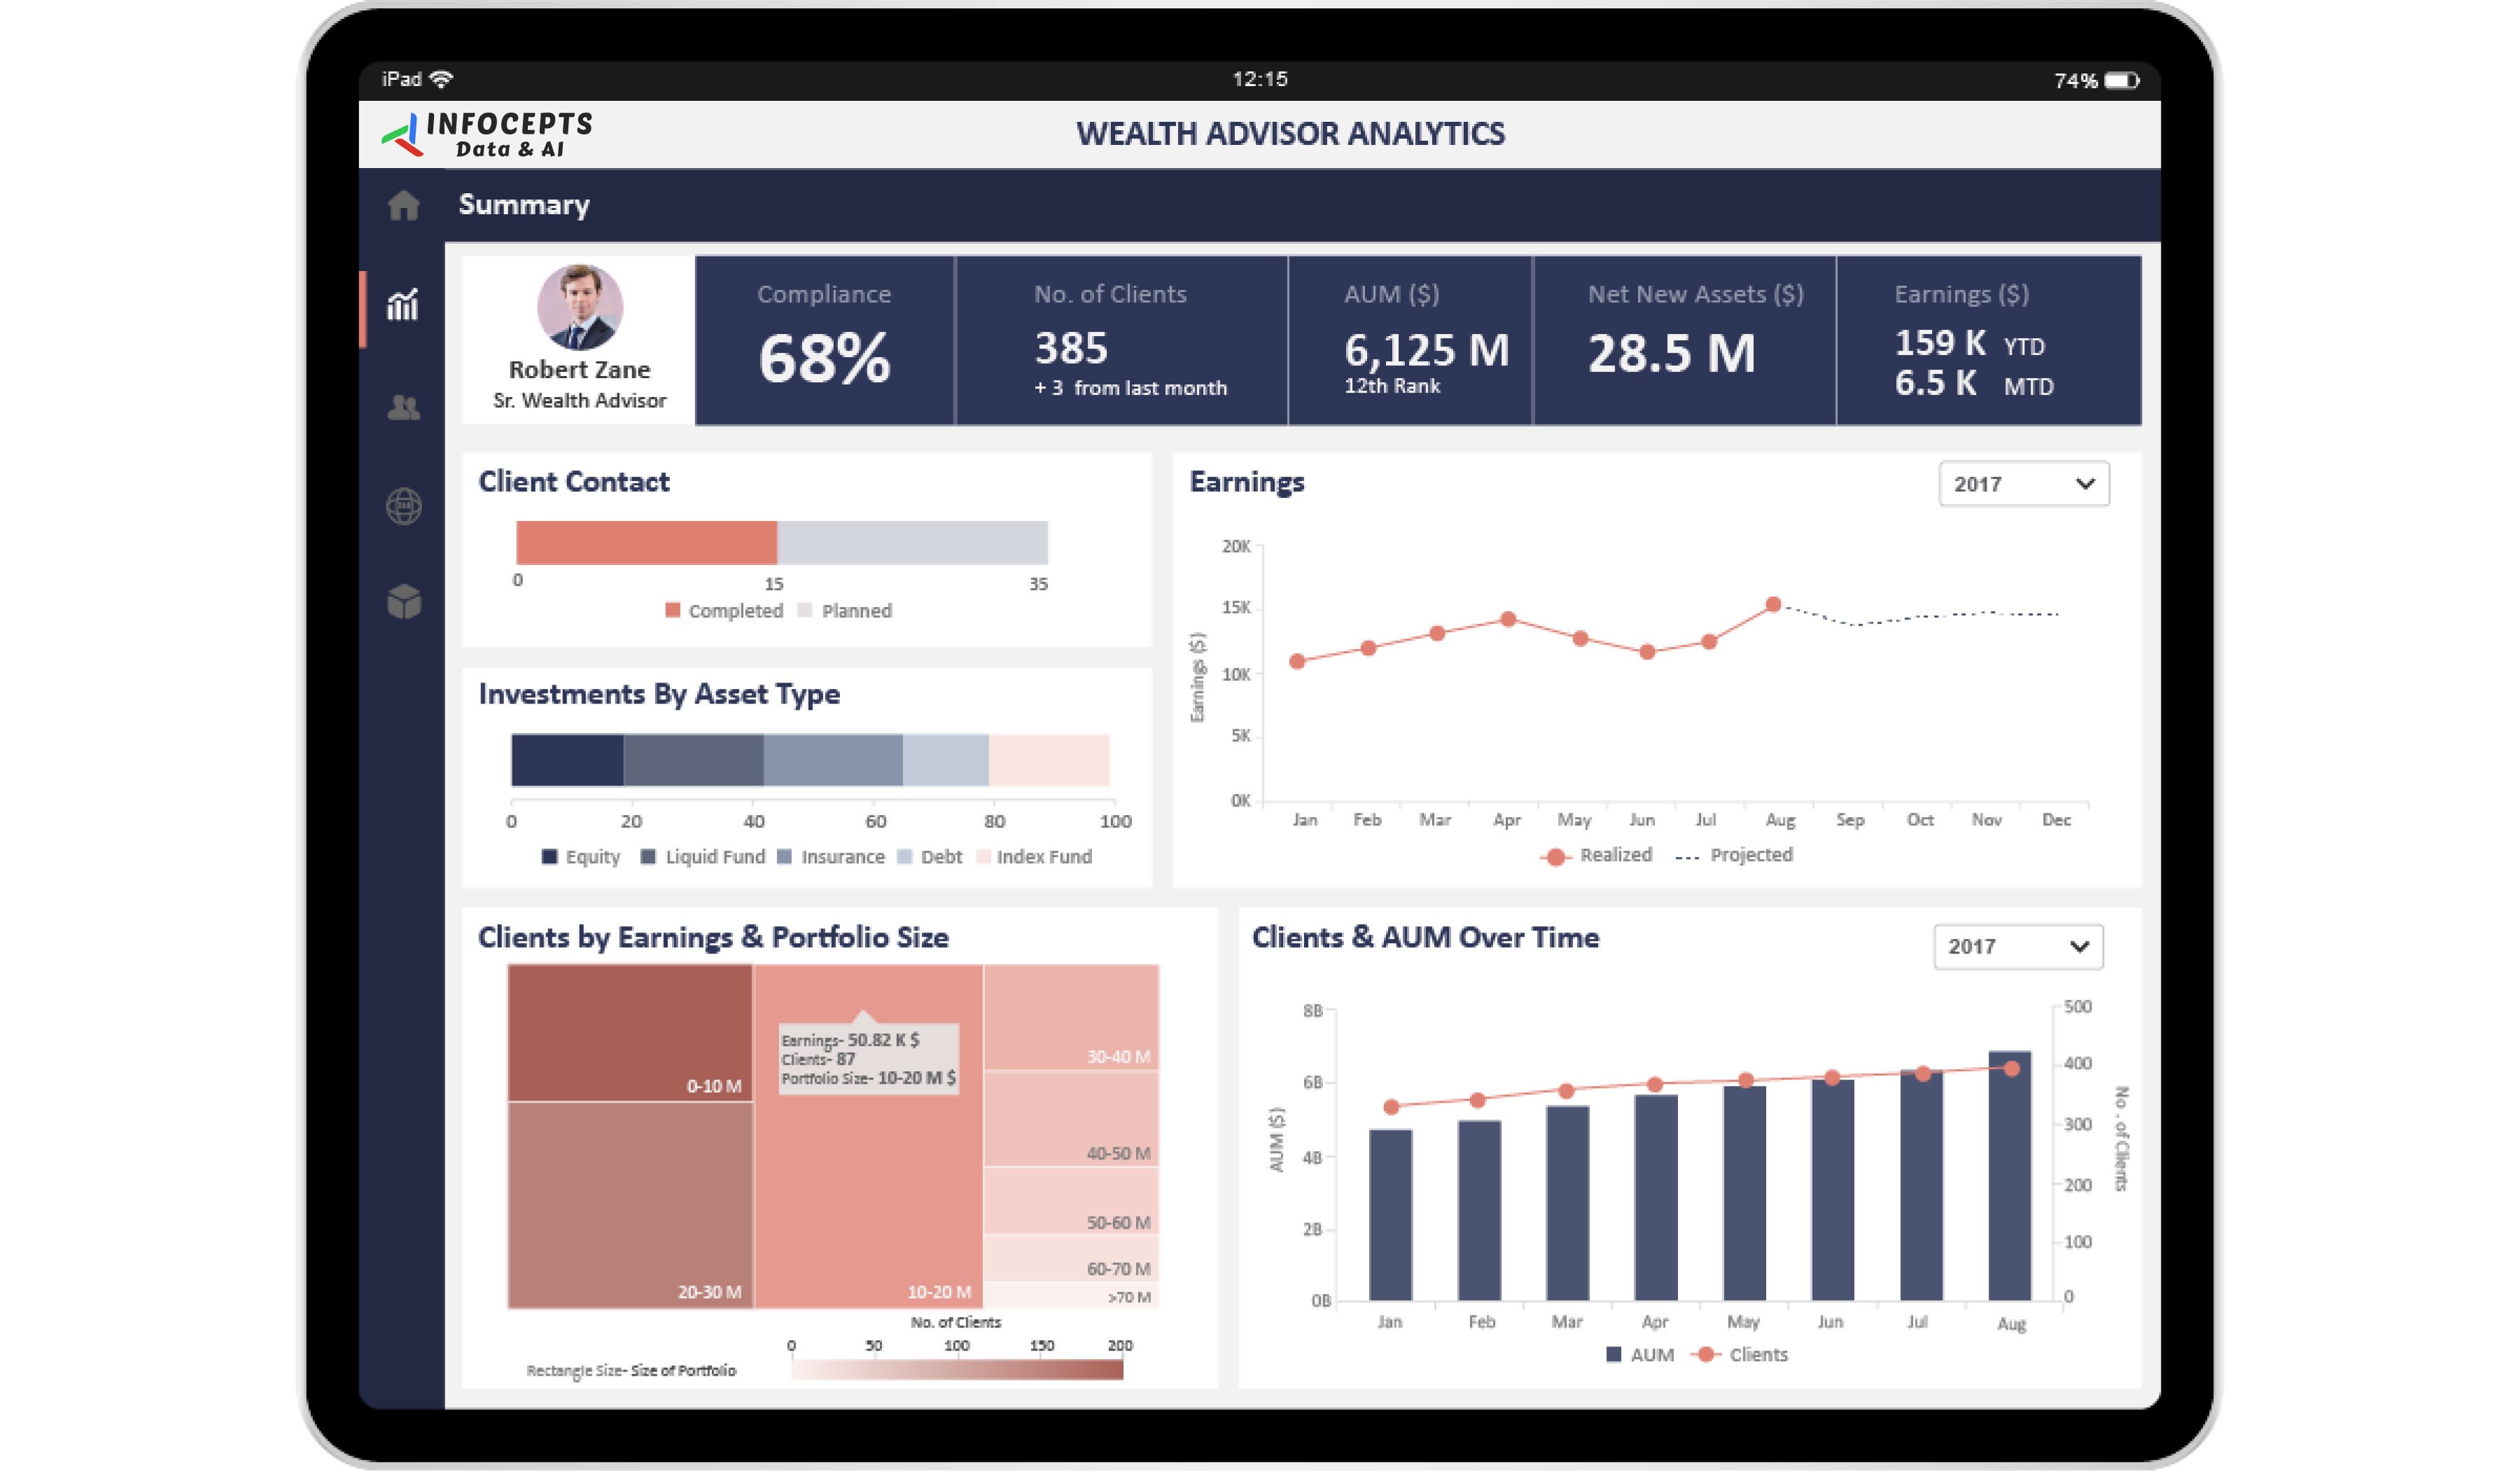
This wealth management analytics dashboard gives wealth advisors and the managers who oversee them one view of advisor performance, product portfolios, and client trends. They use it to decide which relationships to deepen and which products to introduce. Infocepts built the interactive dashboard on MicroStrategy for the wealth management team.
What problem did this dashboard by Infocepts solve for the wealth management team?
Advisors had to pull performance, portfolio, and client data from scattered reports before they could act. That slowed the move from spotting an opportunity or risk to acting on it. Infocepts brought portfolio, CRM, and transaction data into one interactive view through data engineering and integration, so advisors have key client information at hand.
What does the wealth management analytics dashboard track?
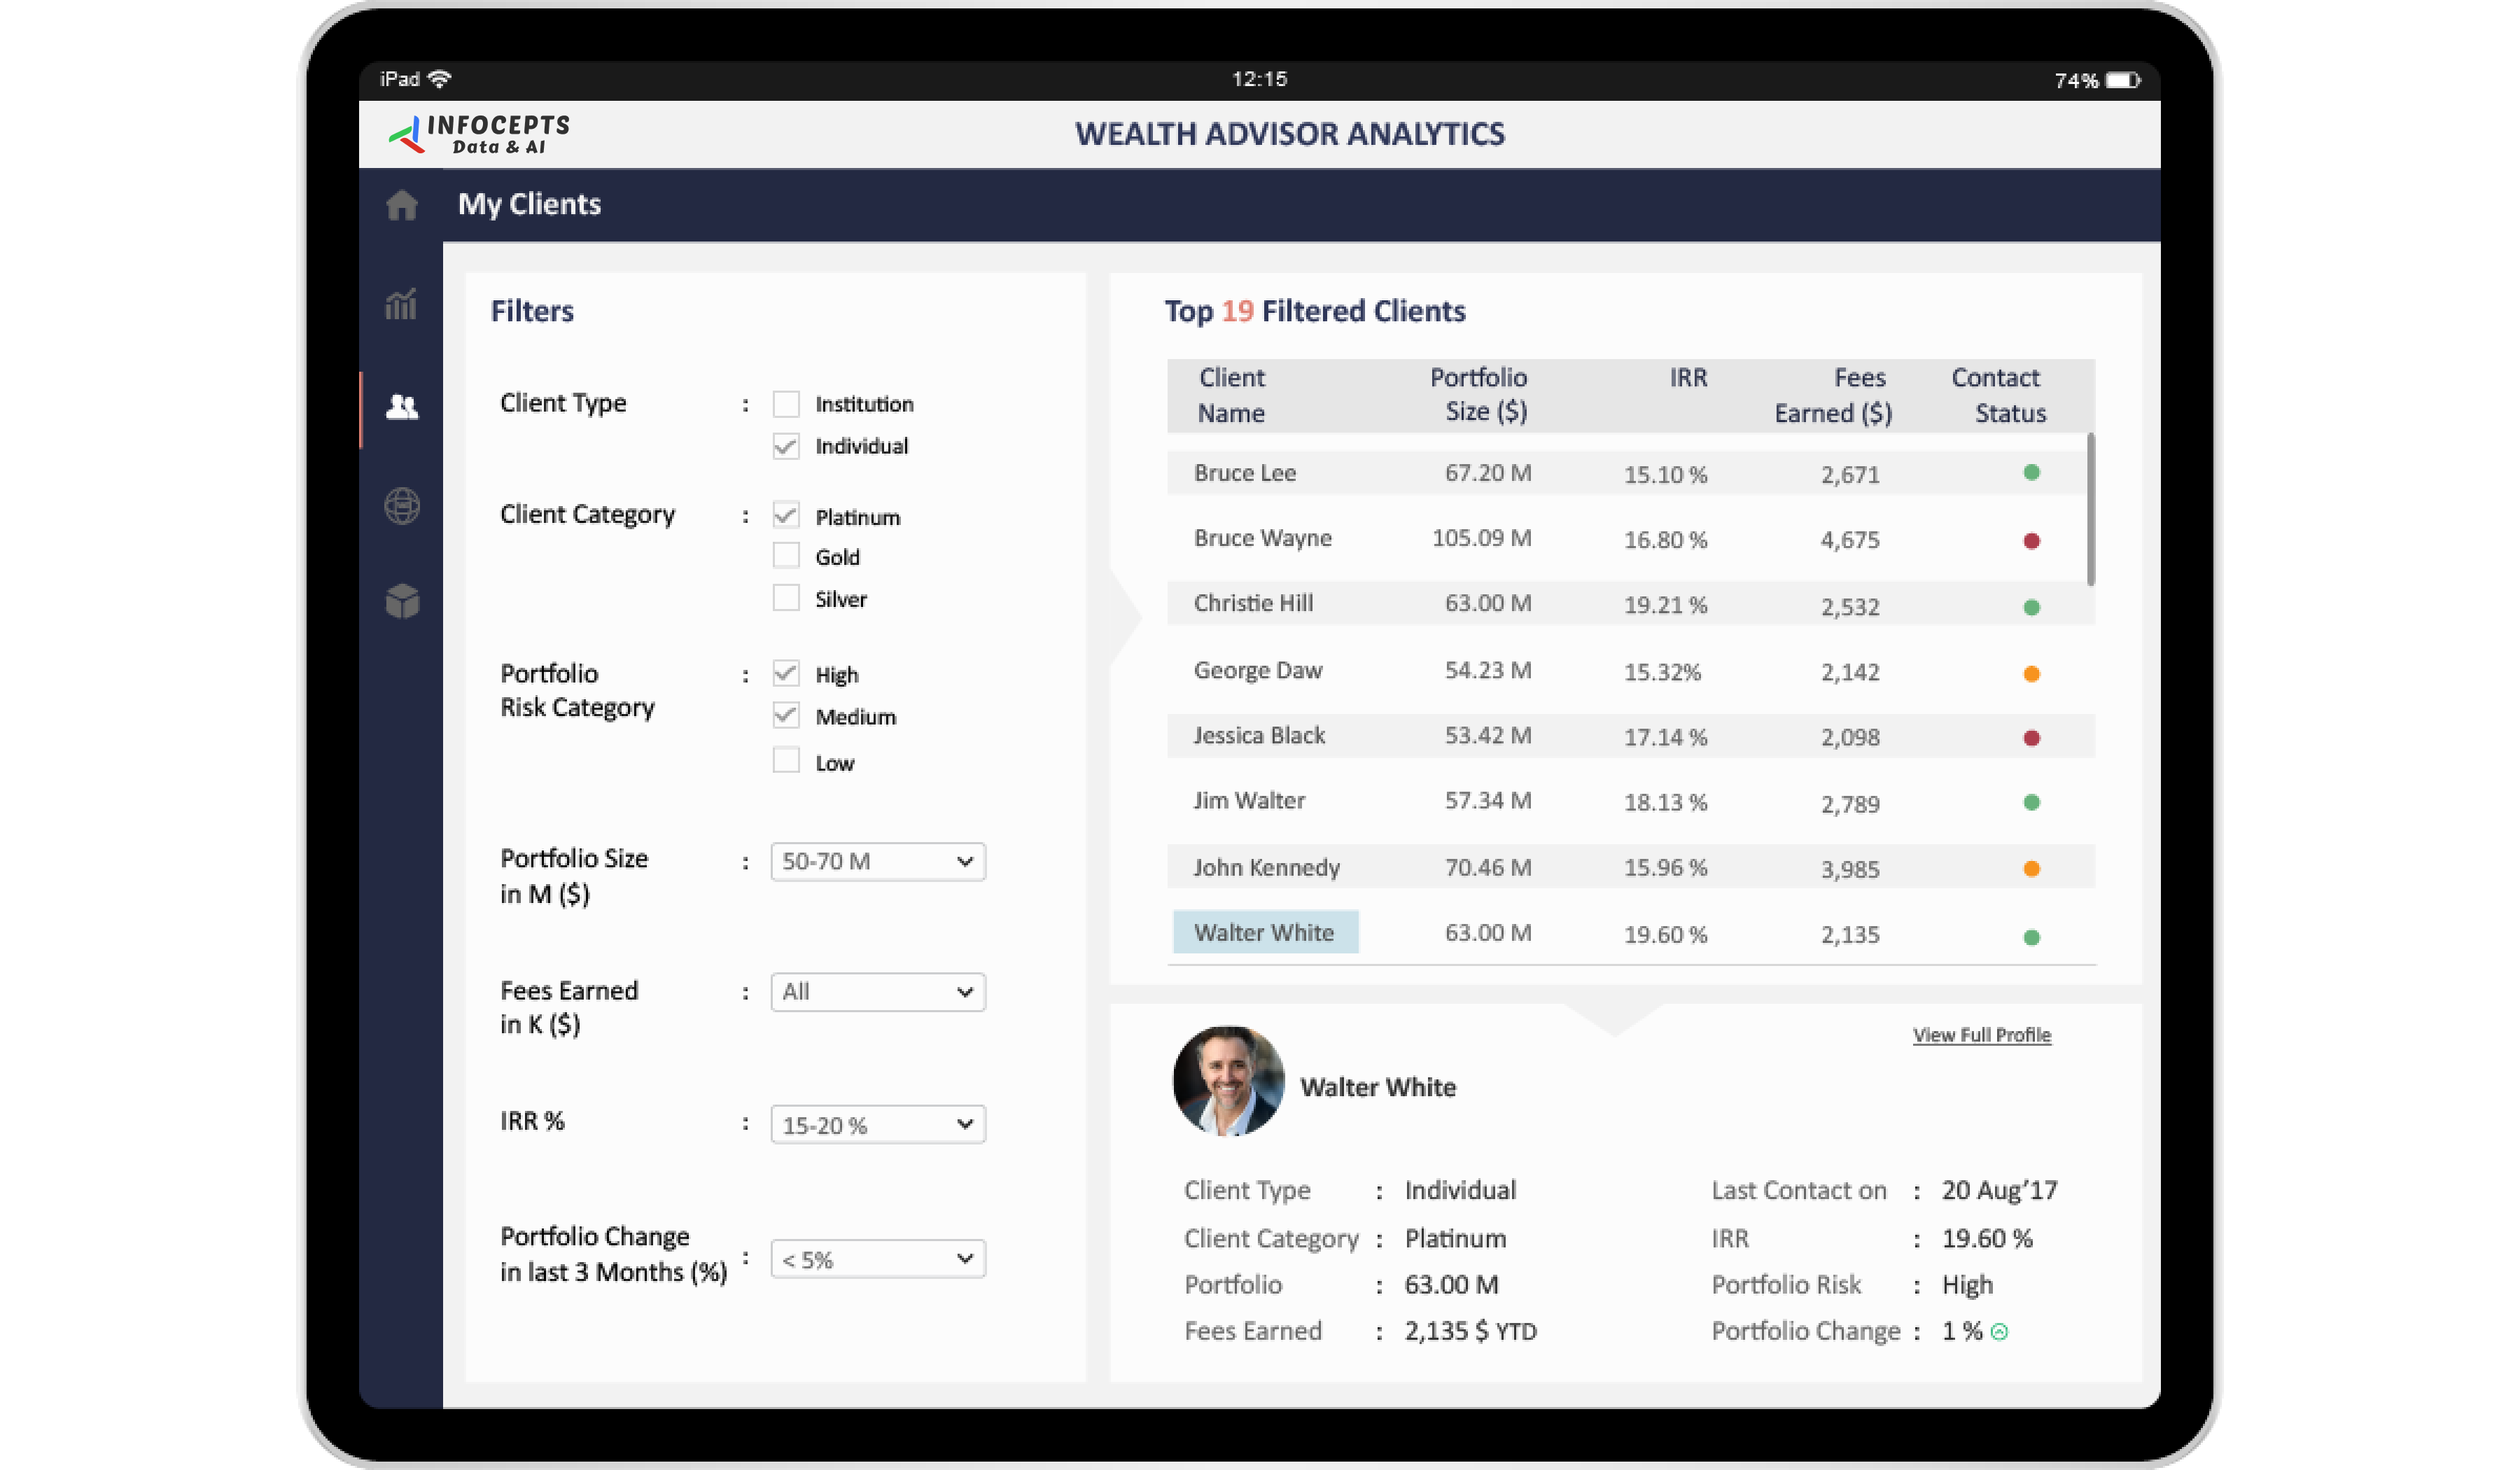
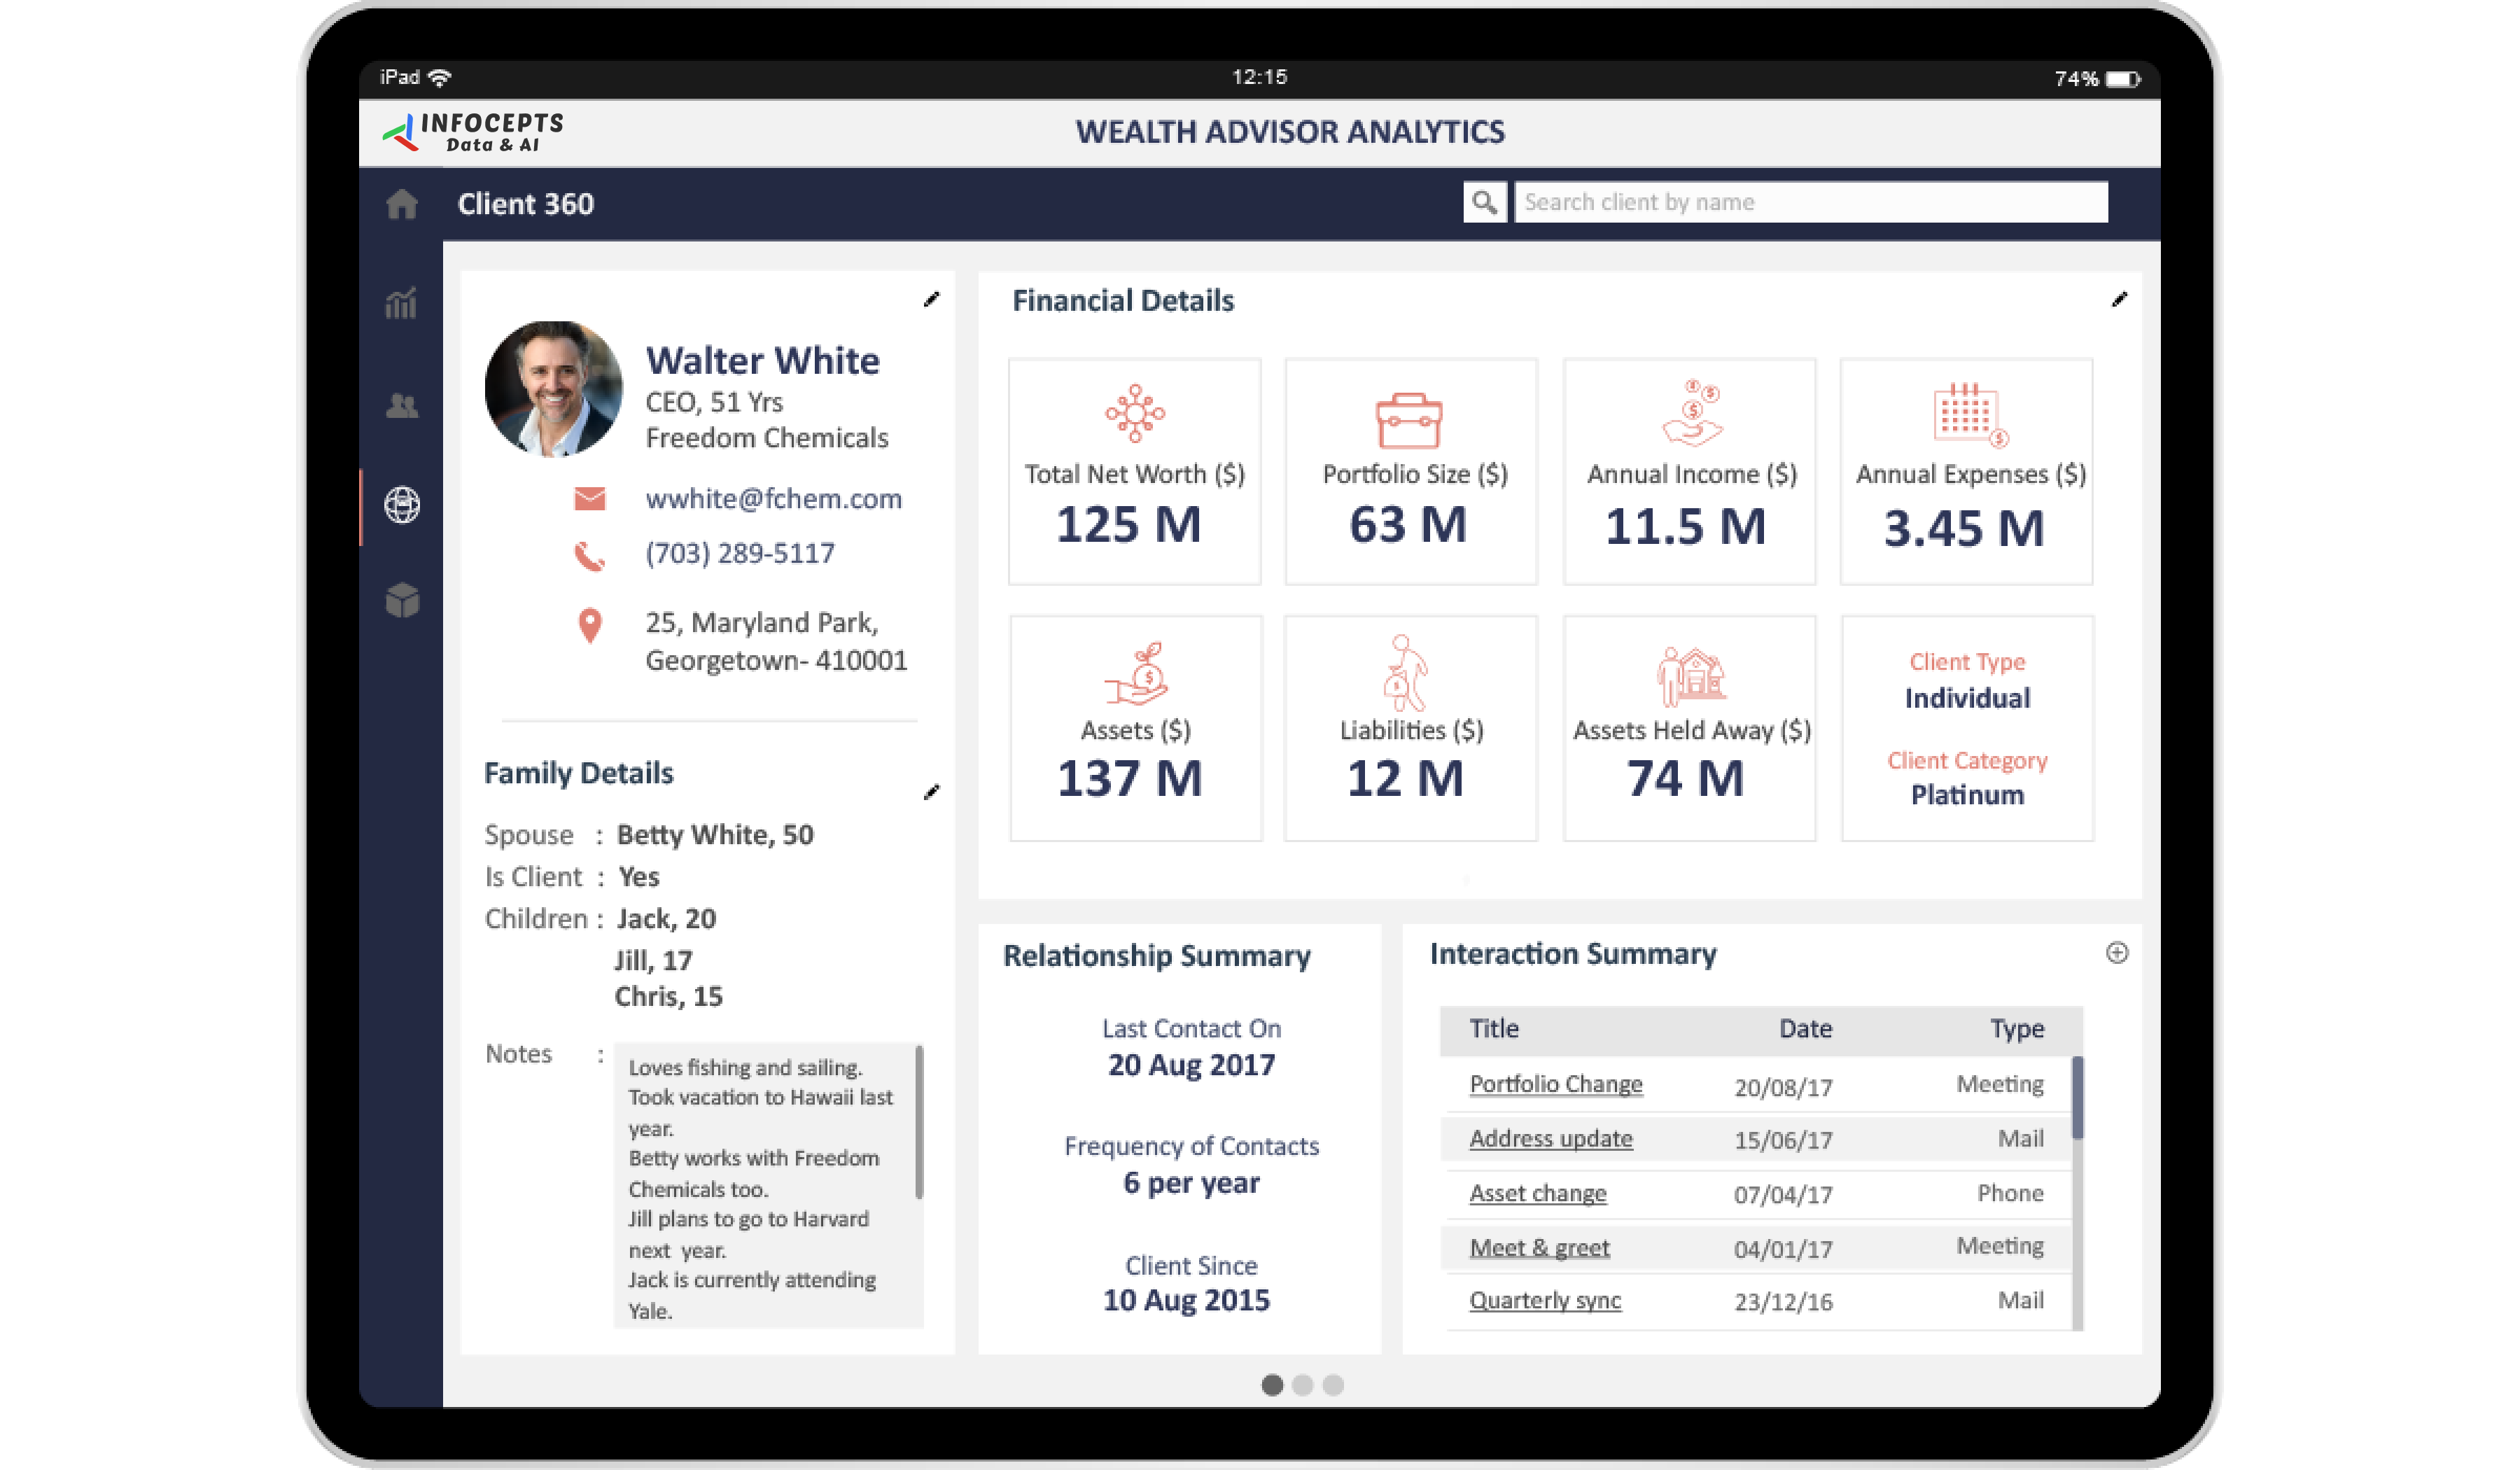
It tracks advisor performance, product portfolios, and client trends. Advisors can see which clients and products are already performing well, and managers can review performance across a book of business. Instant access to key client information sits alongside the metrics, so a client conversation can start with current data.
Who uses wealth management dashboards in financial services firms and how?
Wealth advisors use the dashboard to prepare for client conversations and to spot a chance to expand a relationship or introduce a new product. Management teams use it to oversee advisor performance and client portfolios across a book of business. Both groups work from the same current data.
What business impact did the wealth management team see after rollout?
Reported results include a 54% boost in sales revenue, 23% growth in the active client base, a 47% increase in advisory fees, and a 71% improvement in client engagement. Those are the figures shown for this rollout. They match the purpose of the dashboard: helping advisors boost sales, expand their client base, and grow fee based revenue.
Key metrics: advisor performance, product portfolio performance, client trends, active client base, advisory fees, and client engagement.
Explore more in the Financial Services section, see the product cross sell insights for banking dashboard, or read our case studies.
Want a wealth management dashboard for your advisors? Talk to our team about what to track and how to build it.

 Pranali Lanjewar