


































































43%
Increase in Sustainability Awareness
35%
Rise in Green Technology Implementation
45%
Growth in Sustainable Practices Adoption
31%
Boost in Decision-Making Efficiency
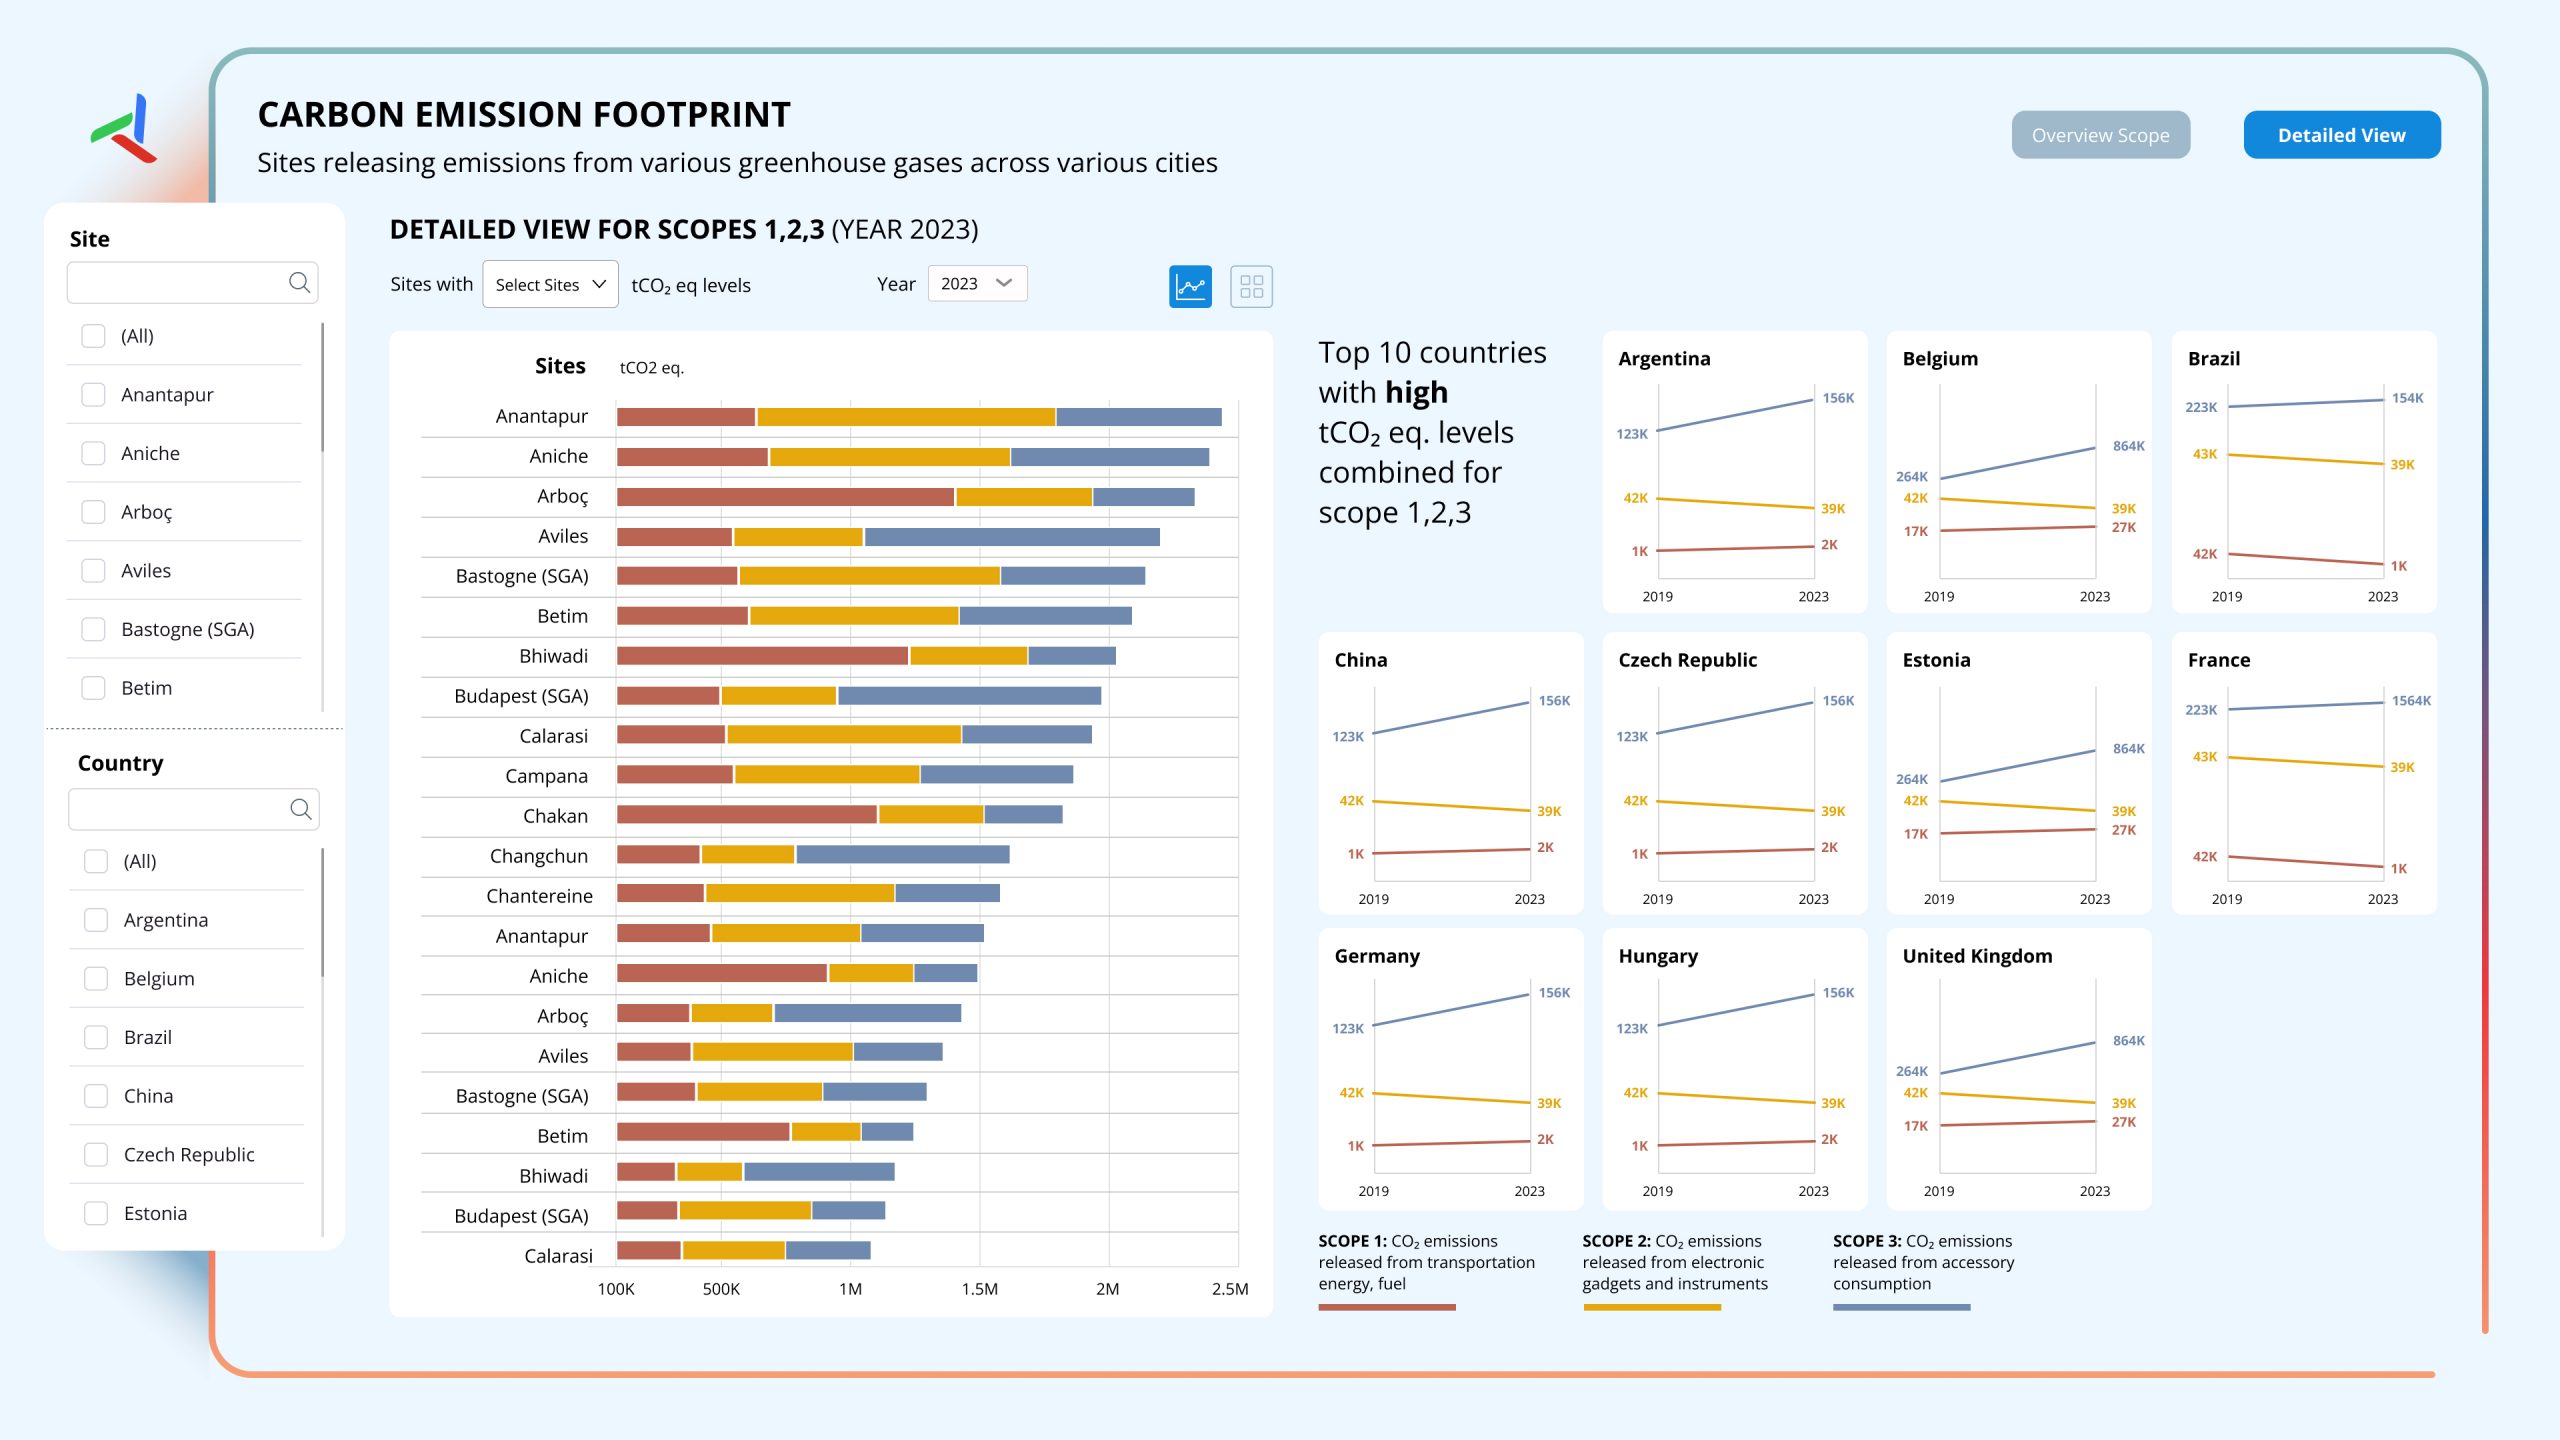
This ESG dashboard tracks CO₂ emissions across multiple sites in real time. Sustainability teams and operations leaders use it to find the biggest emission sources, monitor reduction efforts, and measure progress toward net zero targets. Infocepts built it on Power BI, with clear visuals and trend views.
What problem did this dashboard by Infocepts solve for the sustainability team?
Sustainability teams often work from separate site level reports, which makes progress hard to see. Infocepts built one real time view of emissions across multiple sites. Emissions and operational data come together through data engineering and integration, so teams see where emissions come from and whether reduction efforts are working.
What does the global CO₂ emissions monitoring dashboard track?
It tracks CO₂ emissions across sites, highlights the key contributors, and shows trends over time. Teams can see major emission sources and monitor reduction efforts against sustainability goals. Trend views make a net zero target measurable day to day, rather than visible only in an annual report.
Who uses ESG dashboards in sustainability teams and how?
Sustainability and ESG teams use it to track progress toward targets and decide where reduction efforts should focus. Site and operations leaders, whose facilities are measured against those targets, use it to see their own contribution. Because emissions are monitored continuously, teams can correct course before a reporting deadline.
What business impact did the sustainability team see after rollout?
Reported results include a 43% increase in sustainability awareness and a 45% growth in sustainable practices adoption. It also reports a 35% rise in green technology implementation and a 31% boost in decision making efficiency. These are the results shown for the sustainability team after rollout.
Key metrics: CO₂ emissions by site, major emission sources, reduction progress, emissions trends, and progress toward net zero targets.
See more data visualization examples from other teams and industries, or read our case studies.
Want an ESG dashboard for your sites? Talk to our team about what to track and how to build it.

 Pranali Lanjewar



